How analyses run
Every analysis runs on your own machine, over the files you opened: in the Analysis panel, or in a
shell with the chromosomix command line, which runs the same code. Nothing is uploaded. This page covers
what every task has in common; each task’s own page is listed at the end.
Running a task
Section titled “Running a task”- Open the Analysis panel, the right-most column. 4 shows and hides it.
- Click a task’s row. The drawer opens with its form, the price of the run and run.
- Set the form, read the price, and press run. The results appear in the drawer, and beside the map when they are a track or a set of intervals.
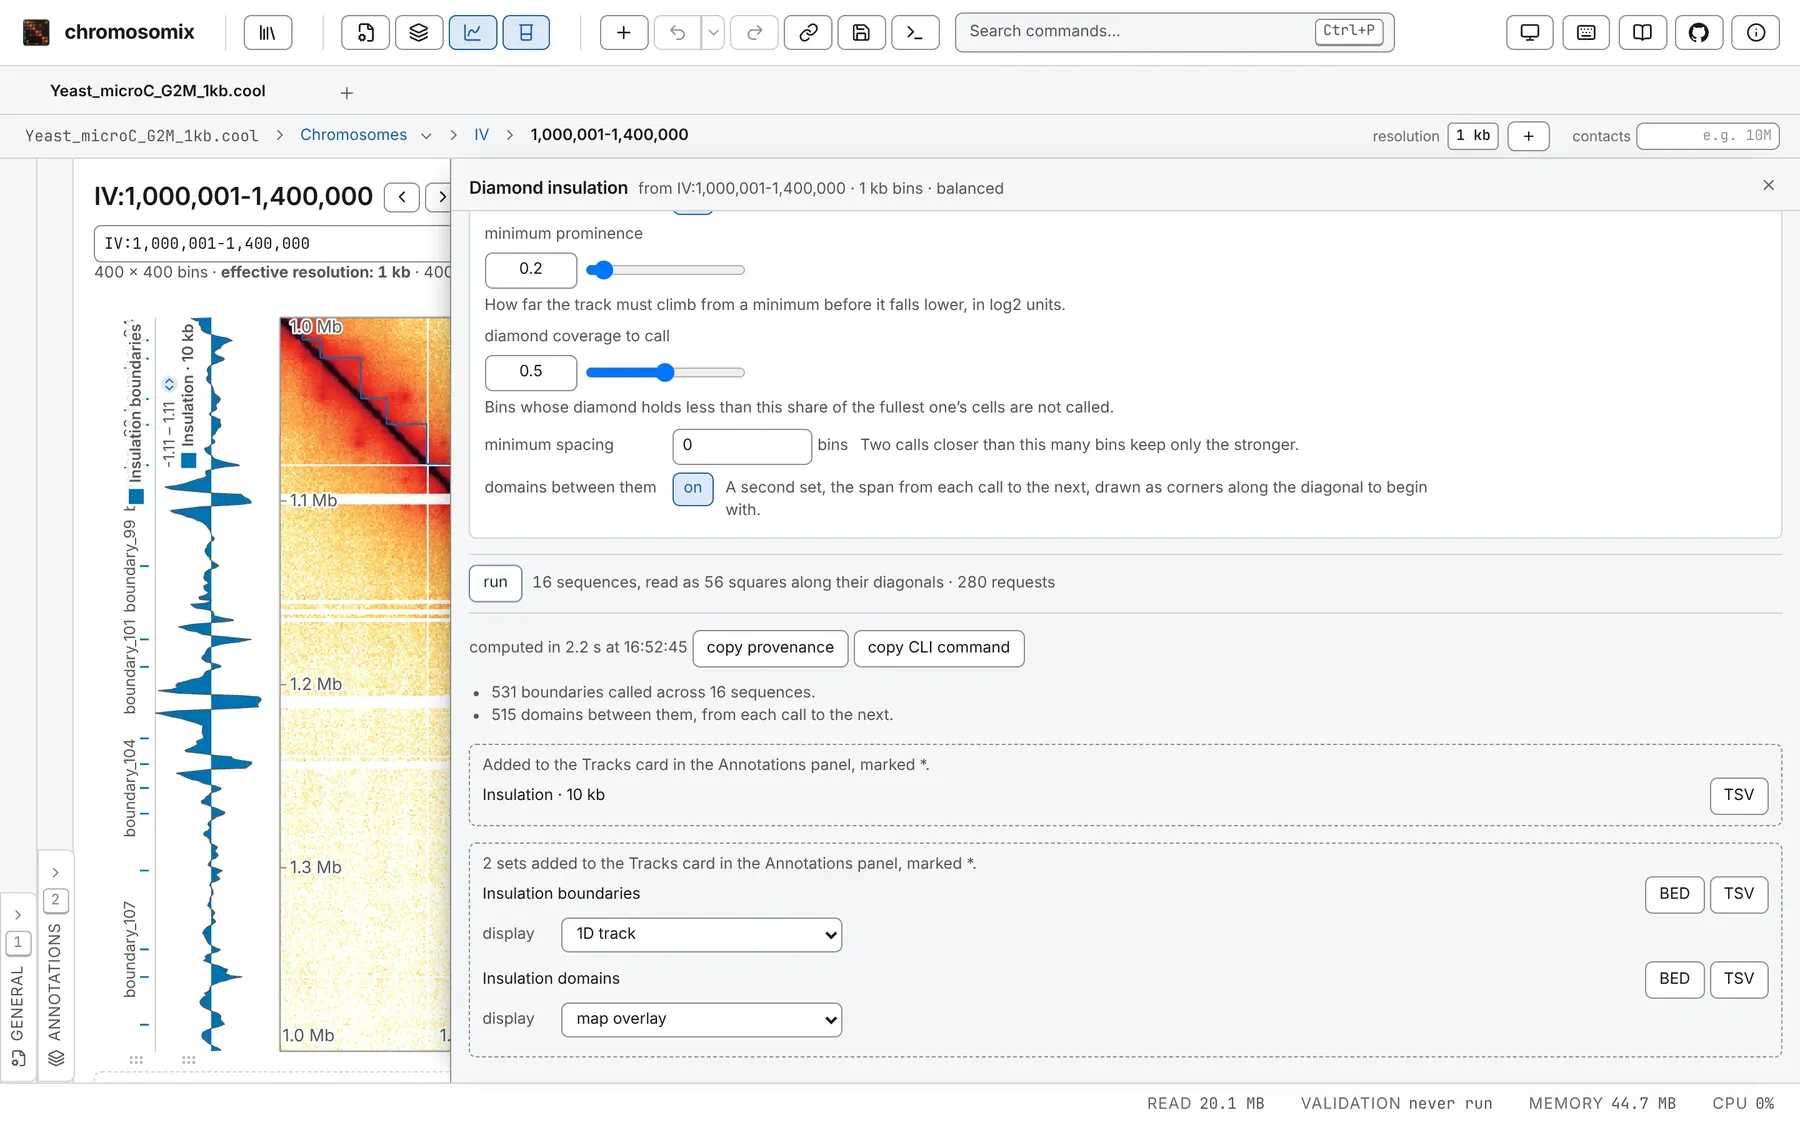
The drawer floats over the map; drag its left edge to widen it. Its ✕, or Esc when the caret is not in one of its boxes, puts it away. A run carries on, and opening the task again brings back its form and figures.
The Analysis panel
Section titled “The Analysis panel”Tasks sit in three cards: 2D tasks about the contact matrix, 3D tasks about a model of beads in space, and 1D tasks about tracks and intervals along the sequence. Each row shows the task, a line on what it does, and its state:
| The row says | Which means |
|---|---|
| never run | Not run on this file yet. |
| queued | Waiting: one job runs at a time. |
| a percentage, or running, with a turning ring | Running. The line under the title names the step, and the row has a stop button. Over a deck, 2 of 5 says which map. |
| done in … | Finished, in that long. |
| failed | Stopped on an error; the line under the title says why. |
| cancelled | You stopped it. |
The box above the cards filters the list. Every word must match a task’s title, line, card or other names: TAD finds the domain callers, pileup aggregate peak analysis, A/B the compartments, decay P(s). Enter opens the first task that can run; Esc empties the box.
A greyed row is waiting for a file and says what to load, such as Load a loop set (BEDPE), or a
feature set (BED, GTF). A task that cannot apply to the open file is not listed: per-cell contact QC
appears only for an .scool. With no contact map open, only the 1D tasks run; on a deck with no map
starred, the map tasks wait until you star one.
The ? after a task’s state marks one that re-implements a published method. Point at it, or tap it,
for the method, the paper’s DOI and how the task came out in the validation:
green if identical or equivalent, in the text’s colour if not compared yet.
What a task reads
Section titled “What a task reads”- The map: the open one. On a deck of maps side by side, the starred one, and the button reads run on ★. run on all N maps runs once per map and gives each map a tab; the all maps tab draws the curves on one figure and the tables as one, its first column naming the map.
- The tracks: a 1D task reads the loaded tracks, feature sets and sequences, never a map, and runs once, even on a deck.
- The view, as it is when you press run, for what changes the numbers: the resolution, the score the map is drawn from, the sequences declared circular, and the number of contacts typed in the breadcrumb’s contacts box. The drawer’s heading gives this framing (will run on …, then from …). The result does not follow a later pan or zoom: the heading adds the view has moved since, and recompute here runs it on the view as it is now.
- What the form names, not the window on screen: the sequences ticked (all, unless you untick some), an anchor, a feature set.
- The map’s resolution: one the file stores or one you added (marked
*, as in3 kb*), never the coarser cells of a zoomed-out picture. To run at another, open the map at it. The map report is the exception: its ladder counts from the file’s finest resolution. - Balanced counts, wherever the file carries weights, however the map is drawn;
--no-balanceon the command line reads the raw counts. Coverage is the one task that asks, raw unless you turn its weights on; the map report reads its coverage and its cis and trans raw.
Settings about the matrix, such as a window or a trim near the diagonal, are in bins, so a number means the same cells at every resolution; the run’s notes give base pairs where it matters. Settings about a track, such as a metaplot’s flank, are in base pairs. The form keeps your settings for each task on each file, and an exported session carries them: repeating an analysis is opening it and pressing run.
What it costs, before you press run
Section titled “What it costs, before you press run”Beside run, the drawer says what the run will read:
- Nothing to read: Computed from the block already on screen. No reads.
- A few reads: so many range requests, for one dense square.
- A pass over the file: One pass over the whole pixel table, or so many strips along the diagonals.
Nothing is read until you press run. Where reads can be merged, as in a pileup over thousands of loops, the price is the most the run could need.
A run that cannot happen says why, in red, and run is greyed: Tick at least one sequence., or a limit and the ways round it. Compartments, for instance, refuse a matrix of more than 8,192 bins a side, and say to untick some sequences, open a coarser resolution or read the cis contacts alone.
While it runs
Section titled “While it runs”The map stays live: pan, zoom or switch tabs, and the job keeps running. One job runs at a time in a session; a second waits, queued. Closing the session’s tab cancels its job.
To stop a job, press the stop button on its row or cancel beside run. It stops at its next chunk of work or read (a pass with no read in it runs to its end and its answer is dropped), the row says cancelled, and nothing is added beside the map.
What comes out
Section titled “What comes out”Under run, a finished run shows:
- The record line, computed in 2.0 s at 20:49:46, with copy provenance (the task, its version, every parameter, the framing, the file and the build) and copy CLI command.
- The run’s notes: what it left out, what a setting came to on this file, why a figure is empty. Read them before the numbers.
- Its results, each with its exports.
A result takes one of three forms:
- A value per bin is a track: a row of the Tracks card in the Annotations panel, marked
*, drawn beside the map and in the genome browser like a loaded bigWig. Its tooltip is its provenance and its settings hold its exports: bigWig, bedGraph and TSV. Running the task again replaces it. - A called set (boundaries, domains, peaks, loops, sites) is one row whose display is a 1D track or a map overlay. On the map a place is a point or a short diagonal marker (its look), an extent the corner of its square, a pair a ring. It saves as BED, or BEDPE for pairs, and TSV.
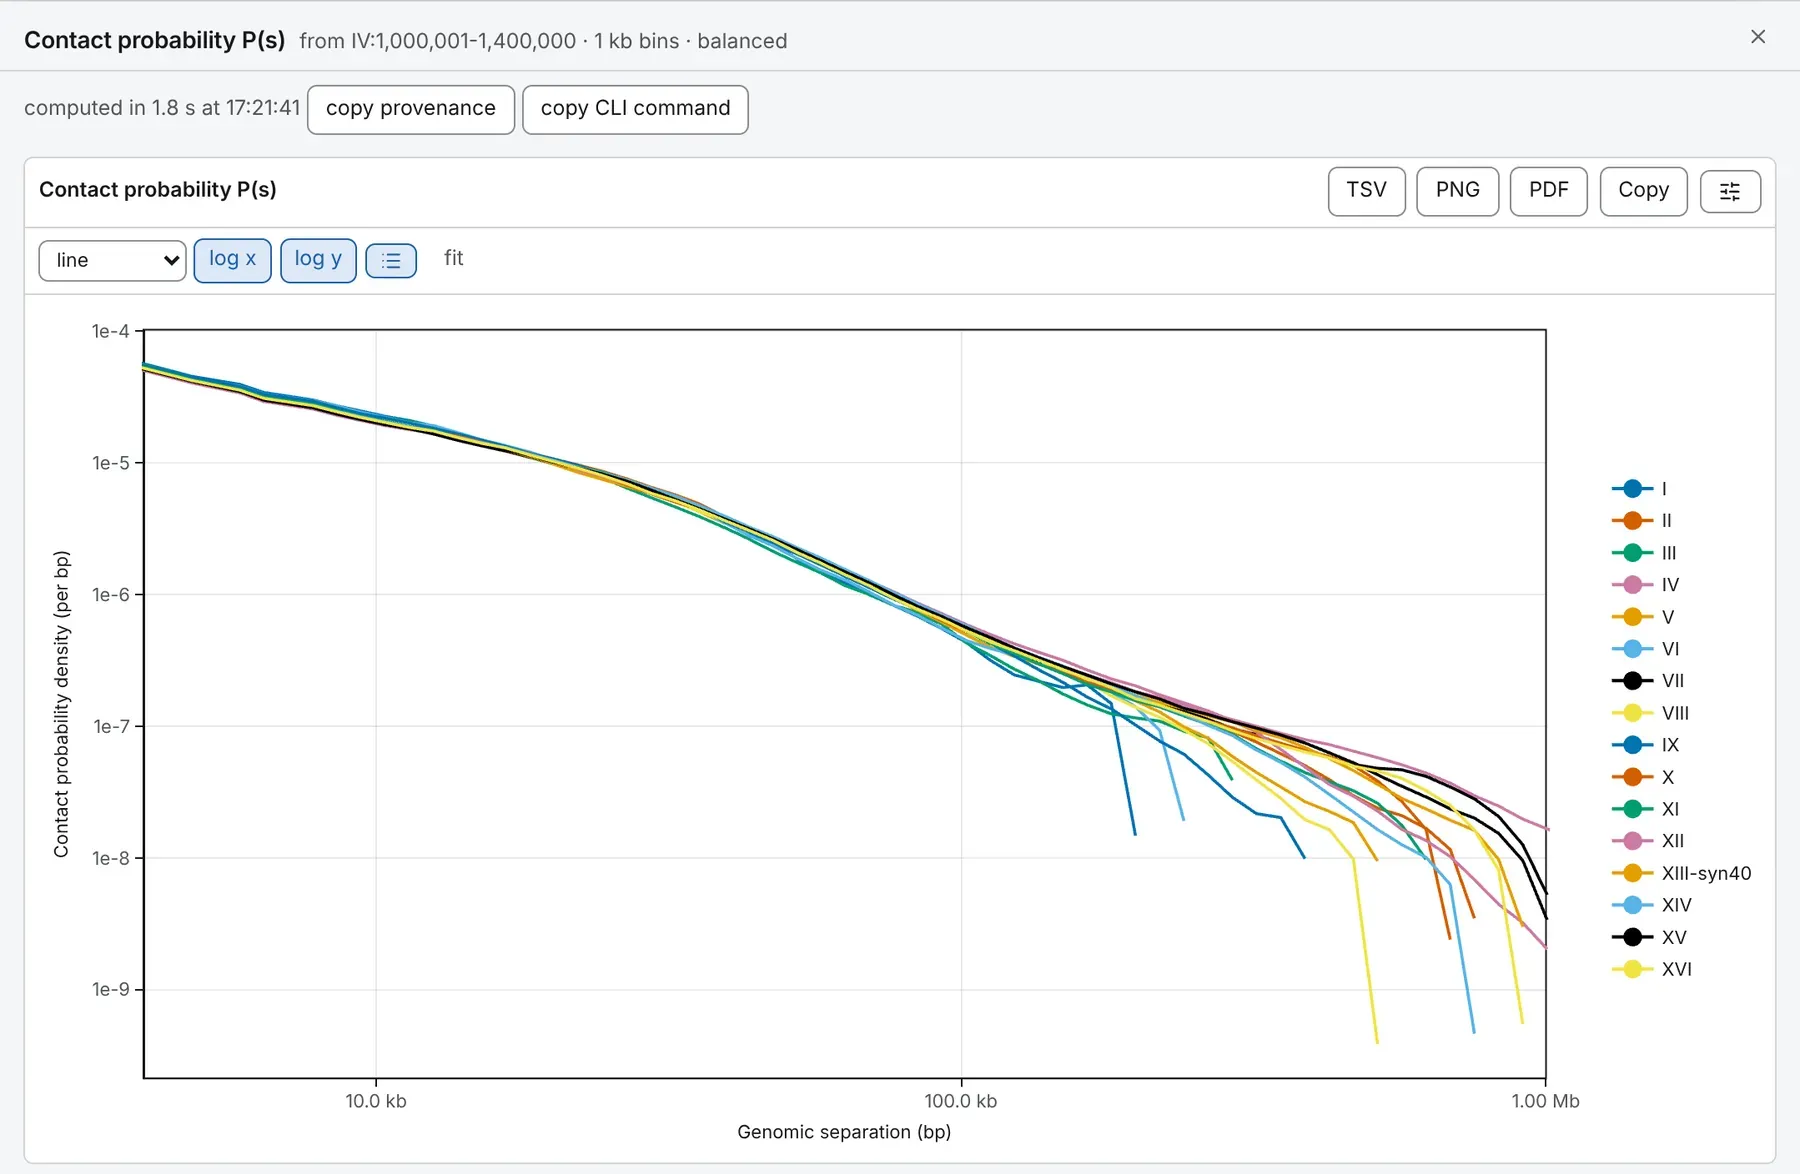
- Curves, matrices and tables are figures in the drawer. Zoom a curve with the wheel or a dragged rectangle; log x, log y and fit set its axes. A table sorts by a click on a column and filters by its box; it shows positions 1-based and saves them 0-based, as a BED holds them. A figure saves as PNG at 300 dpi or vector PDF, Copy puts it on the clipboard, TSV saves its numbers, and the sliders button opens its settings (Figures and export).
Every TSV, bedGraph and BED opens with # lines naming the build, the task and its version, the file, the
framing and every parameter. A bigWig cannot hold them, so a TSV is offered beside it.
older, newer and latest step through the last nine runs of each task on each map; the line between them says which is shown and, in its tooltip, which parameter differs from the latest. The heading, recompute here, the command line and every export follow the run on screen.
A reload keeps the recipe, not the values: the drawer’s results are gone, and a computed track comes back saying values not kept over the reload, with recompute beside it. The same file opened at another resolution keeps its computed tracks; another file leaves them behind.
The same run from a shell
Section titled “The same run from a shell”Every run is written to the console, as it starts, as the chromosomix command that
repeats it: a line per job, failed and stopped runs included. copy CLI command copies it. Run it as it
stands, adding --out for the folder the files go to (the current one otherwise); what a shell cannot be
told is a # note above the line. See From the app to a script and
Installing it.
Every task
Section titled “Every task”Each task’s page gives what it reads and writes and every parameter; the badge says how it came out in the validation.
2D tasks
Coverage and marginalscoverage | How much contact each bin carries, and how much of it stays at home. | Identical |
Cis and trans per sequencecistrans | How much of each sequence’s contact stays on it, and which pairs touch. | Identical |
Per-cell contact QCcellqc | What each cell’s contacts look like, and where in the cycle that puts it. | Not yet validated |
Contact probability P(s)expected | How contact frequency falls with genomic separation. | Identical |
Pairs QCpairsqc | A library’s records: pairtools stats, P(s) by orientation, and restriction fragments. | Identical |
Map reportmapreport | A library’s QC on one page: its contacts, their decay and coverage, and the resolutions it can bear. | Identical |
Scalogramscalogram | How far each bin’s contacts reach, as nested quantile bands. | Not yet validated |
4C profile from an anchorfourc | What one locus touches, as a track you can export. | Identical |
Diamond insulationinsulation | How much contact crosses each bin, and where the boundaries are. | Identical |
Directionality indexdi | Which way each bin looks, and the domains the sign flips call. | Identical |
HiC scorehicscore | The mean contact a bin makes with its near neighbourhood. | Not yet validated |
TAD annotationarrowhead | Contact domains by Juicer’s Arrowhead: nested where they nest, and none where there are none. | Identical |
Compartmentscompartments | Observed/expected, correlated or taken as it is, and its leading components. | Equivalent |
Inter-arm alignmentinterarm | How strongly the two arms of a bacterial chromosome touch, from origin to terminus. | |
Loop callingloops | Call loops as pixels enriched over their local background. | Identical |
Pattern detectionchromosight | Find loops, borders, hairpins, centromeres or stripes by template matching. | Identical |
Reproducibilityhicrep | How much the maps on screen agree, stratum by stratum and pooled. | Identical |
Aggregate peak analysisapa | Pile up the matrix at a set of loops or features, against a control. | Identical |
3D tasks
Model from the mapreconstruct3d | A 3D model of what is loaded: contacts read as distances, beads placed to honour them. | Equivalent |
Model versus mapstructuremap | How well a 3D model’s distances agree with the contacts the map counted. | |
Spatial tracksspatialtracks | The model as tracks: radial position, distance to a locus, local compaction. |
1D tasks
Find a motifmotif | Every place a motif occurs, as sites and as a density track. | Identical |
Restriction sitesrestriction | Where an enzyme cuts the reference, as sites and as a density track. | Identical |
Peak callingpeaks | Narrow peaks from a coverage track, where its smoothed signal curves down (yapc). | Identical |
Base compositioncomposition | GC content, GC skew and AT skew per bin, as tracks. | Identical |
Origin and terminusoriter | Where replication starts and ends, from the GC skew, parS, matS and coverage. | |
Metaplot over a feature setmetaplot | Average track signal at a set of places, with a band and a heatmap. | Identical |
Track correlationtrackcorr | How much every pair of loaded tracks agrees. | Equivalent |
Fraction of signal in featuresfrip | How much of each track sits inside a feature set, against how much of the genome it is. | Identical |
Signal by groupgroupsignal | A track’s values in each group of the genome — A against B — compared and tested. | Identical |
Interval set overlapoverlap | Jaccard, shared bases, how many features touch — and whether that is more than chance. | Identical |
Documentation of chromosomix v0.20.0 · built from 40ec1ec · source