Per-cell contact QC
- In the app
- Analysis panel, under 2D tasks: Per-cell contact QC
- Command
chromosomix cellqc- Reads
- A contact map
- Also known as
- single cell, scool, cell cycle, quality
This task measures each cell of an .scool from its own contacts: its cis and trans shares, and its
shares in the four bands of separation of Nagano et al. (2017), whose near band against its mitotic band
draws the cell cycle as a horseshoe. Run it before you tick the cells to sum: a pseudo-bulk summed across
phases smears the structure you opened the file to see.
Running it
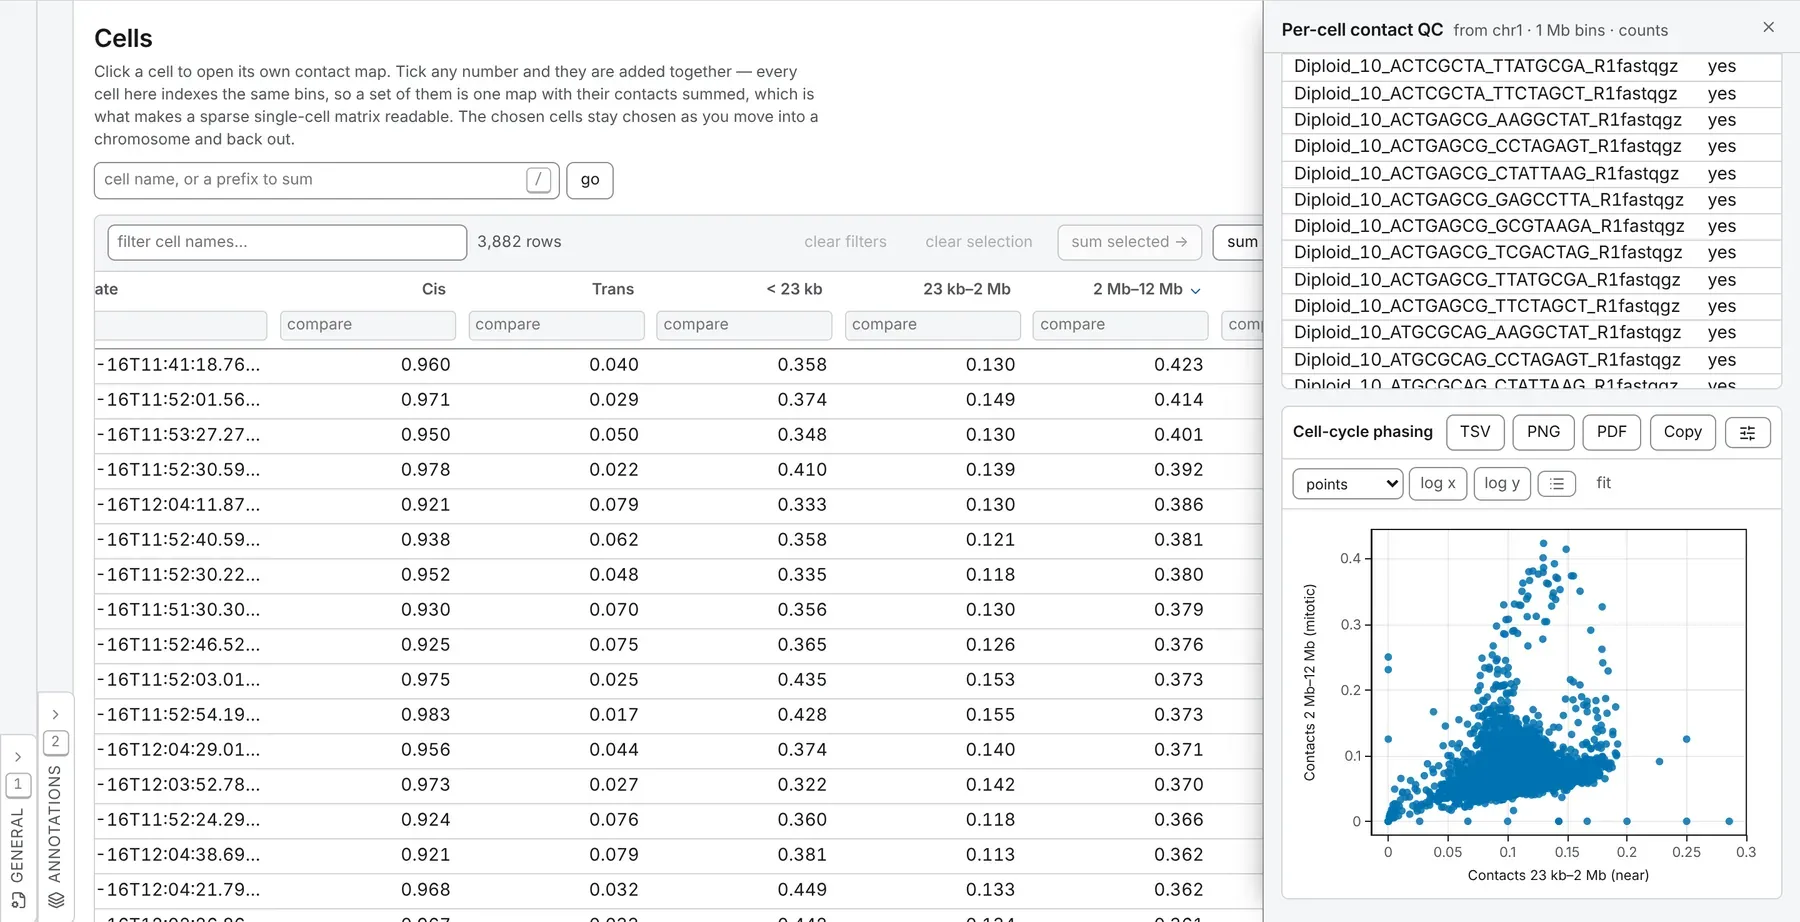
Section titled “Running it”Open an .scool, which opens on its Cells table, choose Per-cell contact QC in the 2D tasks
card of the Analysis panel, leave cells on every cell in the file or pick the ticked ones
only, and press run. The drawer shows a table with a row per cell and the phasing scatter. The
shares also arrive as columns of the Cells table: sort by the near or the mitotic share, tick a run
of cells, and sum them.
The same run from a shell:
chromosomix cellqc <map> [--<parameter> <value> …] --out <dir>Parameters
Section titled “Parameters”The band edges are in base pairs, the paper’s numbers, and sized for mouse: on a smaller genome, set them to its scale.
| Parameter | Takes | Default | What it does |
|---|---|---|---|
| General | |||
cells--cells <value> | all or selected | all | all — what the choice is made from, so this is the answer that helps make it; selected — the ticked ones only. |
use balancing weights--no-balance | a switch | On wherever the file carries balancing weights; --no-balance reads the raw counts. | — |
| Bands | |||
near band, from--nearFrom <n> | a whole number, at least 0, in bp | 23000 | Below this a contact is mostly self-ligation and unligated ends rather than structure. |
near band, to--nearTo <n> | a whole number, at least 1, in bp | 2000000 | — |
mitotic band, to--mitoticTo <n> | a whole number, at least 1, in bp | 12000000 | The near band’s upper edge is this band’s lower one; beyond it is the far band. |
What it writes
Section titled “What it writes”- table: a table: TSV
- curve: a curve: TSV
On the command line every file goes into --out as <file stem>.cellqc.<output>.<ext>, and each TSV opens with # lines naming the build, the file and every parameter that produced it.
Reading the result
Section titled “Reading the result”The table has a row per cell: its name, whether it is Ticked, its Contacts and Stored pixels,
its Cis and Trans shares, and its share in each band, headed by the band’s edges — < 23 kb,
23 kb–2 Mb, 2 Mb–12 Mb and > 12 Mb at the defaults. Every share is of all the cell’s contacts,
trans included. A contact within one bin has a separation of 0 and counts in the first band. A cell with
no contact has blank shares, not zeros.
In the phasing scatter each point is a cell, its near share across and its mitotic share up. Across a population the cells fall on a horseshoe, and where a cell lies along it is where it was in the cycle: just after mitosis a large mitotic band and little near contact, in G1 the reverse, and S and G2 between. The task assigns no phase: where to cut the horseshoe is yours, by ticking cells in the Cells table.
On an assembly whose longest sequence lies inside the near band, such as a yeast, the mitotic and far bands are empty and the scatter says nothing; the run’s note says so. Set the band edges to its scale.
Documentation of chromosomix v0.20.0 · built from 40ec1ec · source