Comparing two maps
A contact map is symmetric, so its lower half can show something else: a second file, or the same file read another way.
Two files in one square
Section titled “Two files in one square”- Open the first map.
- On the Contact maps card, in the Annotations panel, use Load a map into the lower triangle: drop a map file on it, drag a row onto it from the Files panel, or click it.
The first file is drawn above the diagonal, the second below; the diagonal itself is the first file’s.
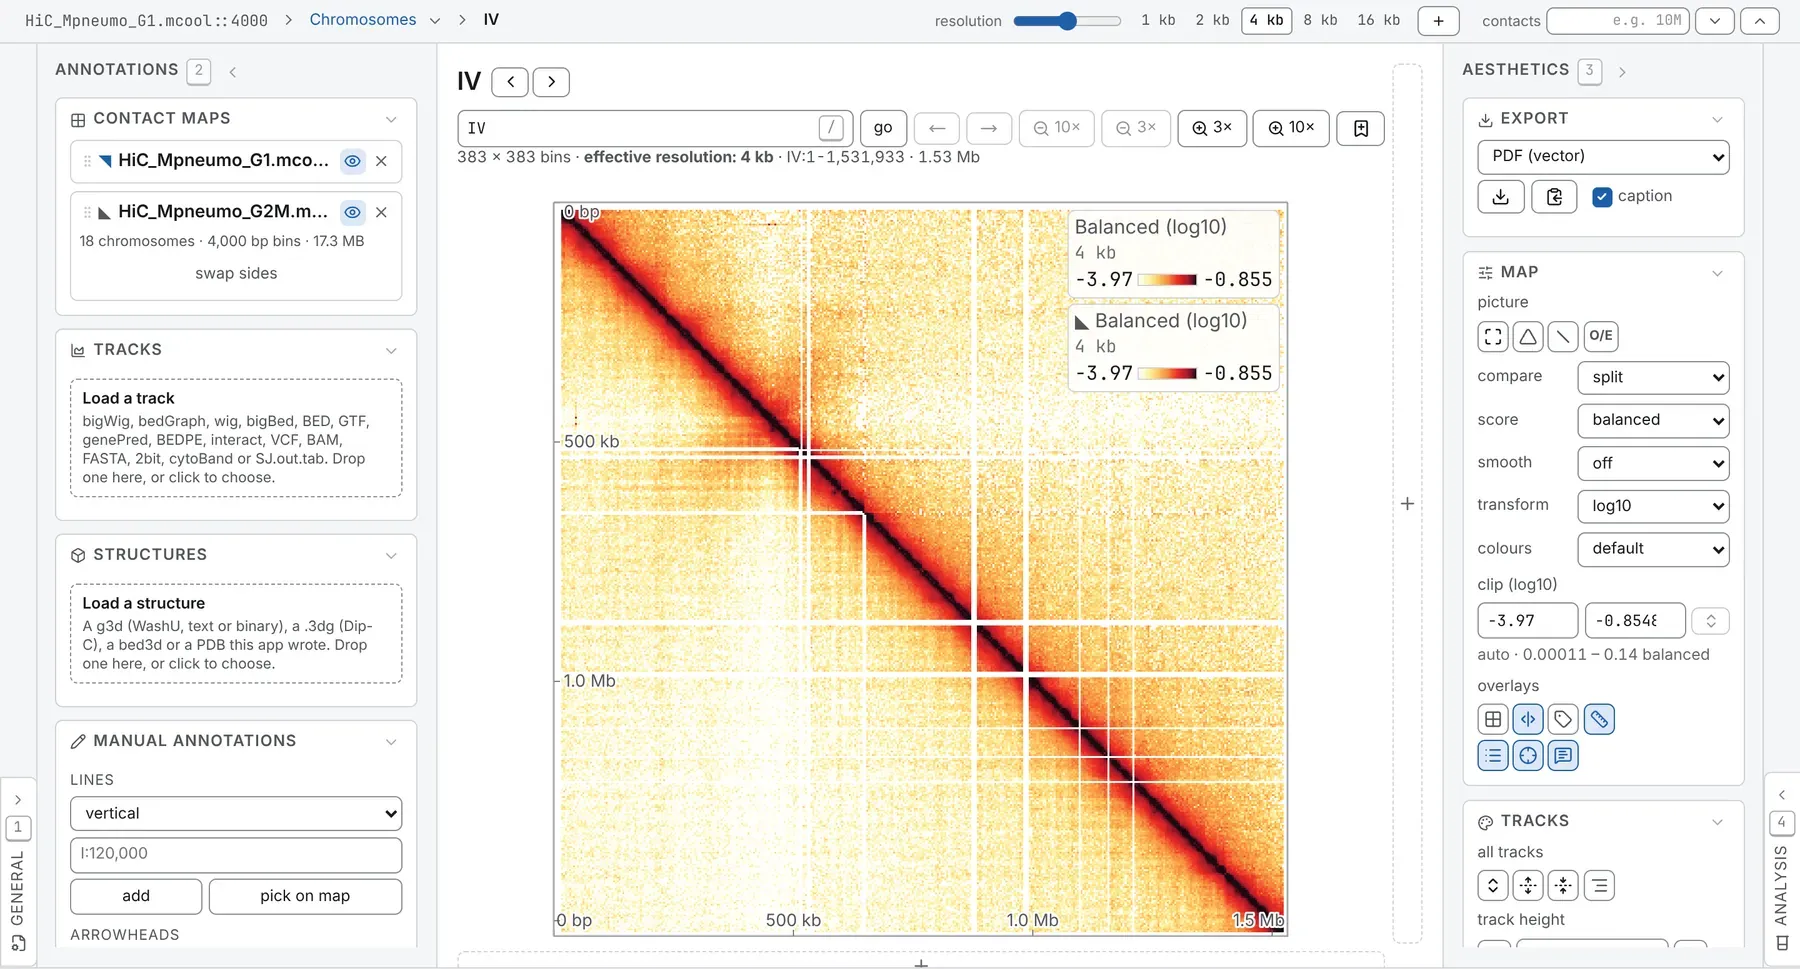
- Each file has a row on the card,
◥upper and◣lower. The lower row’s eye hides the lower triangle and keeps the file open; its × closes it. Closing the first file leaves the second as an ordinary map. - swap sides puts the other file above the diagonal.
- A name typed on a row is used wherever the map is named.
- Hovering a cell gives both files’ counts.
- The link carries the second file as
uri2. On a change of resolution it follows at the same bin size, or the card says it has none.
What the two files must share
Section titled “What the two files must share”The card refuses a pair that does not share one grid, and says why:
- The same bin size: open the matching resolution of the second file.
- The same sequences, in the same order, at the same lengths.
chr1and1, orchrMandMT, count as one name, and the second file may have extra sequences after the first file’s last. One name at two lengths, as in hg19 and hg38, is a difference.
One scale for both
Section titled “One scale for both”Both triangles share one colour scale, so libraries of different depth differ everywhere by depth alone: draw both to one total first, with the chevrons after the contacts box (Drawing maps to one total).
Balanced values keep each file’s own unit. A cooler balanced by cooler balance has rows that sum
to one; a .hic balanced by Juicer’s KR or SCALE has rows that sum to the library’s depth per bin,
and saturates beside the cooler. Compare such a pair by their O/E.
Ratio and difference
Section titled “Ratio and difference”Once a second file is open, compare, on the Map card under the picture row, reduces the pair to what differs:
| compare | Draws |
|---|---|
| split | each file in its own triangle, in its own counts |
| ratio | the first file divided by the second, over the whole square |
| difference | the first file minus the second, over the whole square |
A ratio opens on log2 and a difference on a linear scale, both on a diverging ramp centred where
the files agree (1 or 0), so only the disagreement shows. split gives the map its own scale
back. The link carries the choice as op.
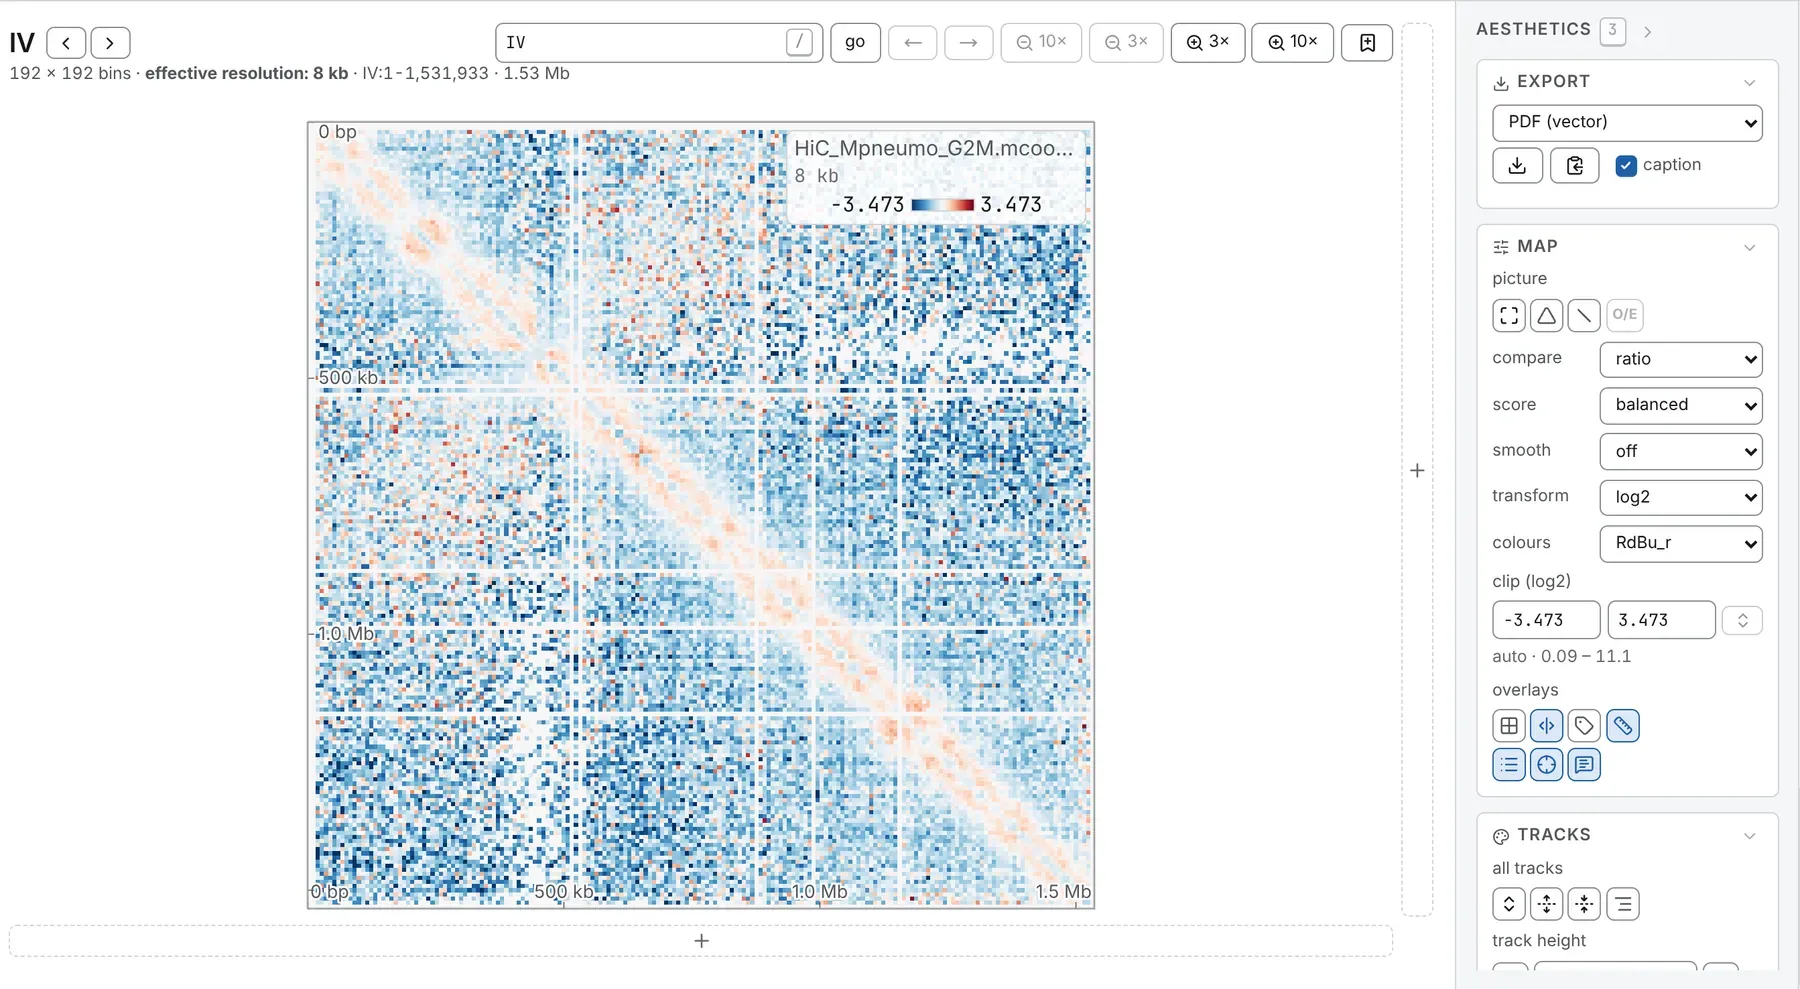
- A ratio needs contacts in both files. A cell empty in either is drawn in the ramp’s middle colour, and the readout says there is no value. A difference keeps its zeros.
- Depth shows as a flat wash: a ratio of raw counts is roughly the ratio of the depths everywhere. Draw both to one total, or compare balanced values.
- A ratio is not divided by the expected: the second map is the baseline, so O/E is greyed while a ratio is drawn. It applies again under split and difference.
Each file is smoothed before the two are combined. Zoomed out, cells are pooled by how far they depart from no change, so neither direction fades.
Two readings of one file
Section titled “Two readings of one file”To draw, say, balanced counts above the diagonal and their O/E below:
- On the Map card, open the ◣ lower tab, beside ◥ map.
- Switch own reading on. The lower reading starts as a copy of the upper one.
- Set its score, smooth, O/E, transform, colours and clip.
While it is on, a dot marks the ◣ lower tab. Switched off, the triangle mirrors again and keeps its settings for next time.
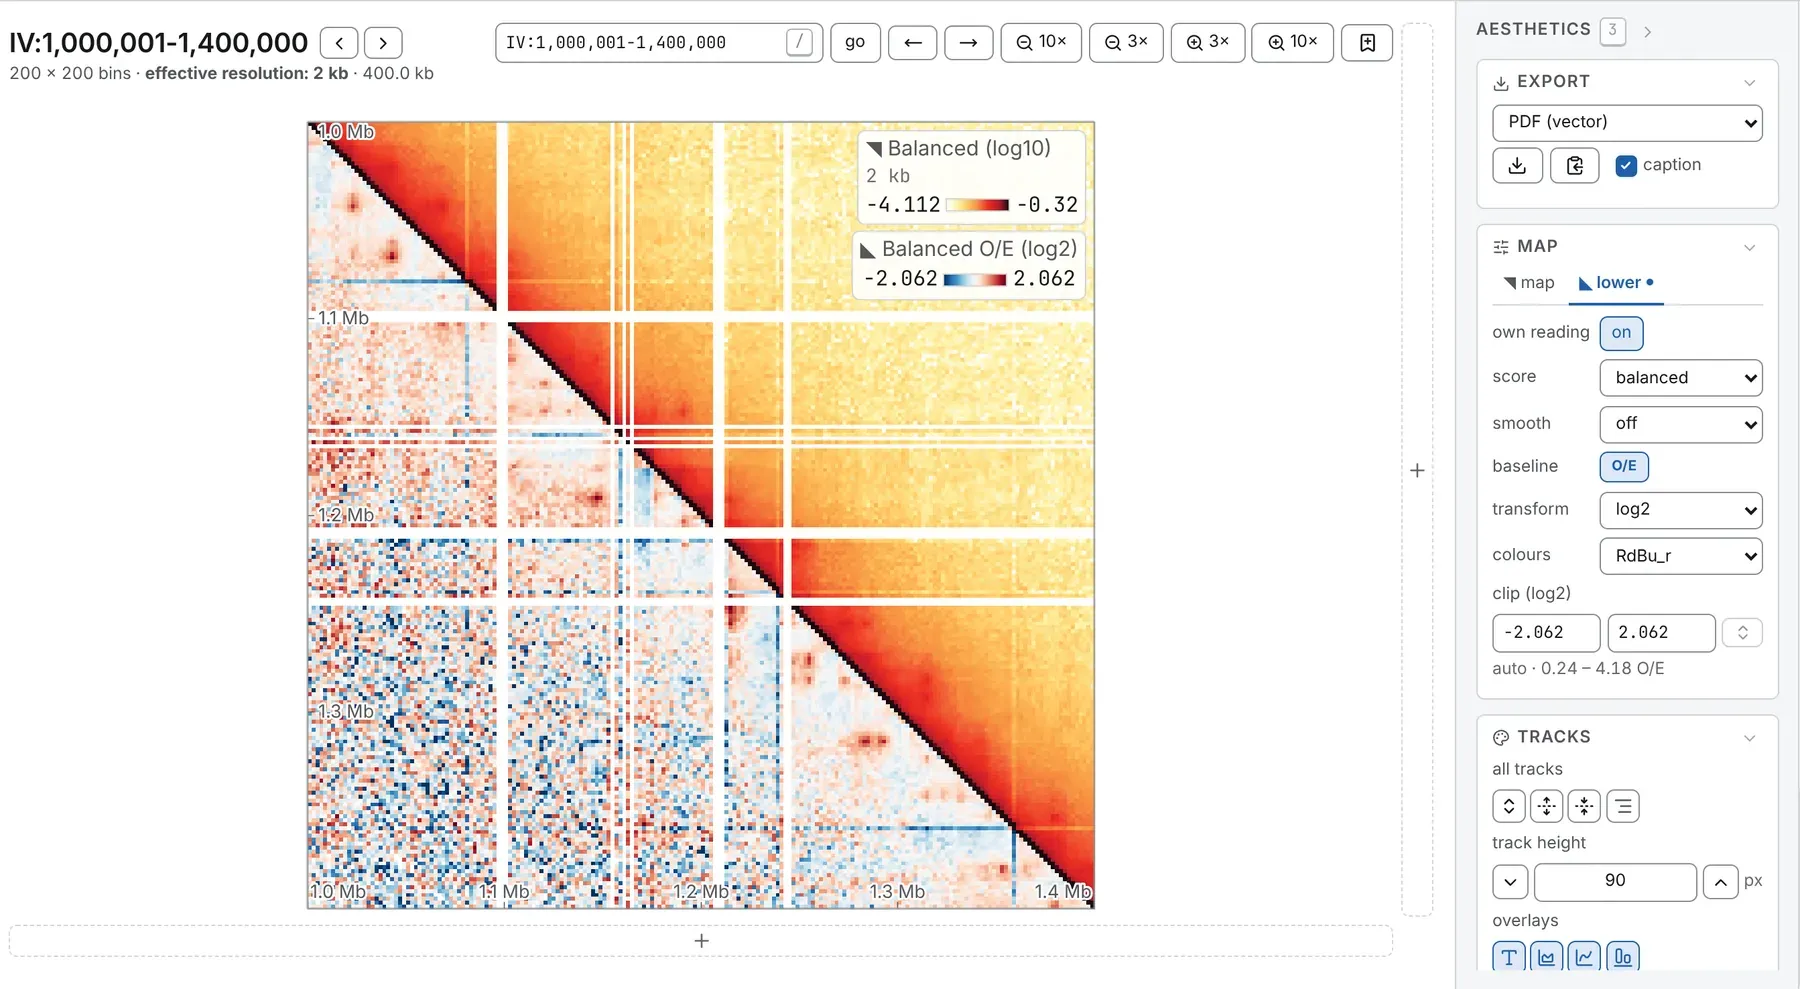
Each reading has its own colour scale and key, ◥ or ◣. The readout names the reading under the
pointer, and a saved figure carries both keys and a second caption line. The window, resolution,
turn, overlays and tracks stay the map’s.
It is offered on a map of one file, not beside a second file nor in a deck. A link carries it as
lower=true with score2, oe2, smooth2, transform2, colormap2, vmin2 and vmax2
(Link keys).
One square or side by side
Section titled “One square or side by side”Maps at different bin sizes or with different sequence lists, more than two maps, or maps each on its own colour scale go side by side instead; only one square draws a ratio or a difference. A tab can do both: a deck whose first map has a second file in its lower triangle.
To compare two tracks, tick both on the Tracks card, choose combine…, then ratio or difference (The genome browser).
Documentation of chromosomix v0.20.0 · built from 40ec1ec · source