Map report
- In the app
- Analysis panel, under 2D tasks: Map report
- Command
chromosomix mapreport- Reads
- A contact map
- Runs first
- Contact probability P(s), Coverage and marginals, Cis and trans per sequence, at its defaults, and reads the result
- Also known as
- QC, quality, report, map resolution, MultiQC, summary, depth
A new library’s QC in one run, on one page: how many contacts it holds and how many are cis, how they decay, how evenly they cover the genome, which sequences keep to themselves, and down to which bin size most bins still have contacts.
Running it
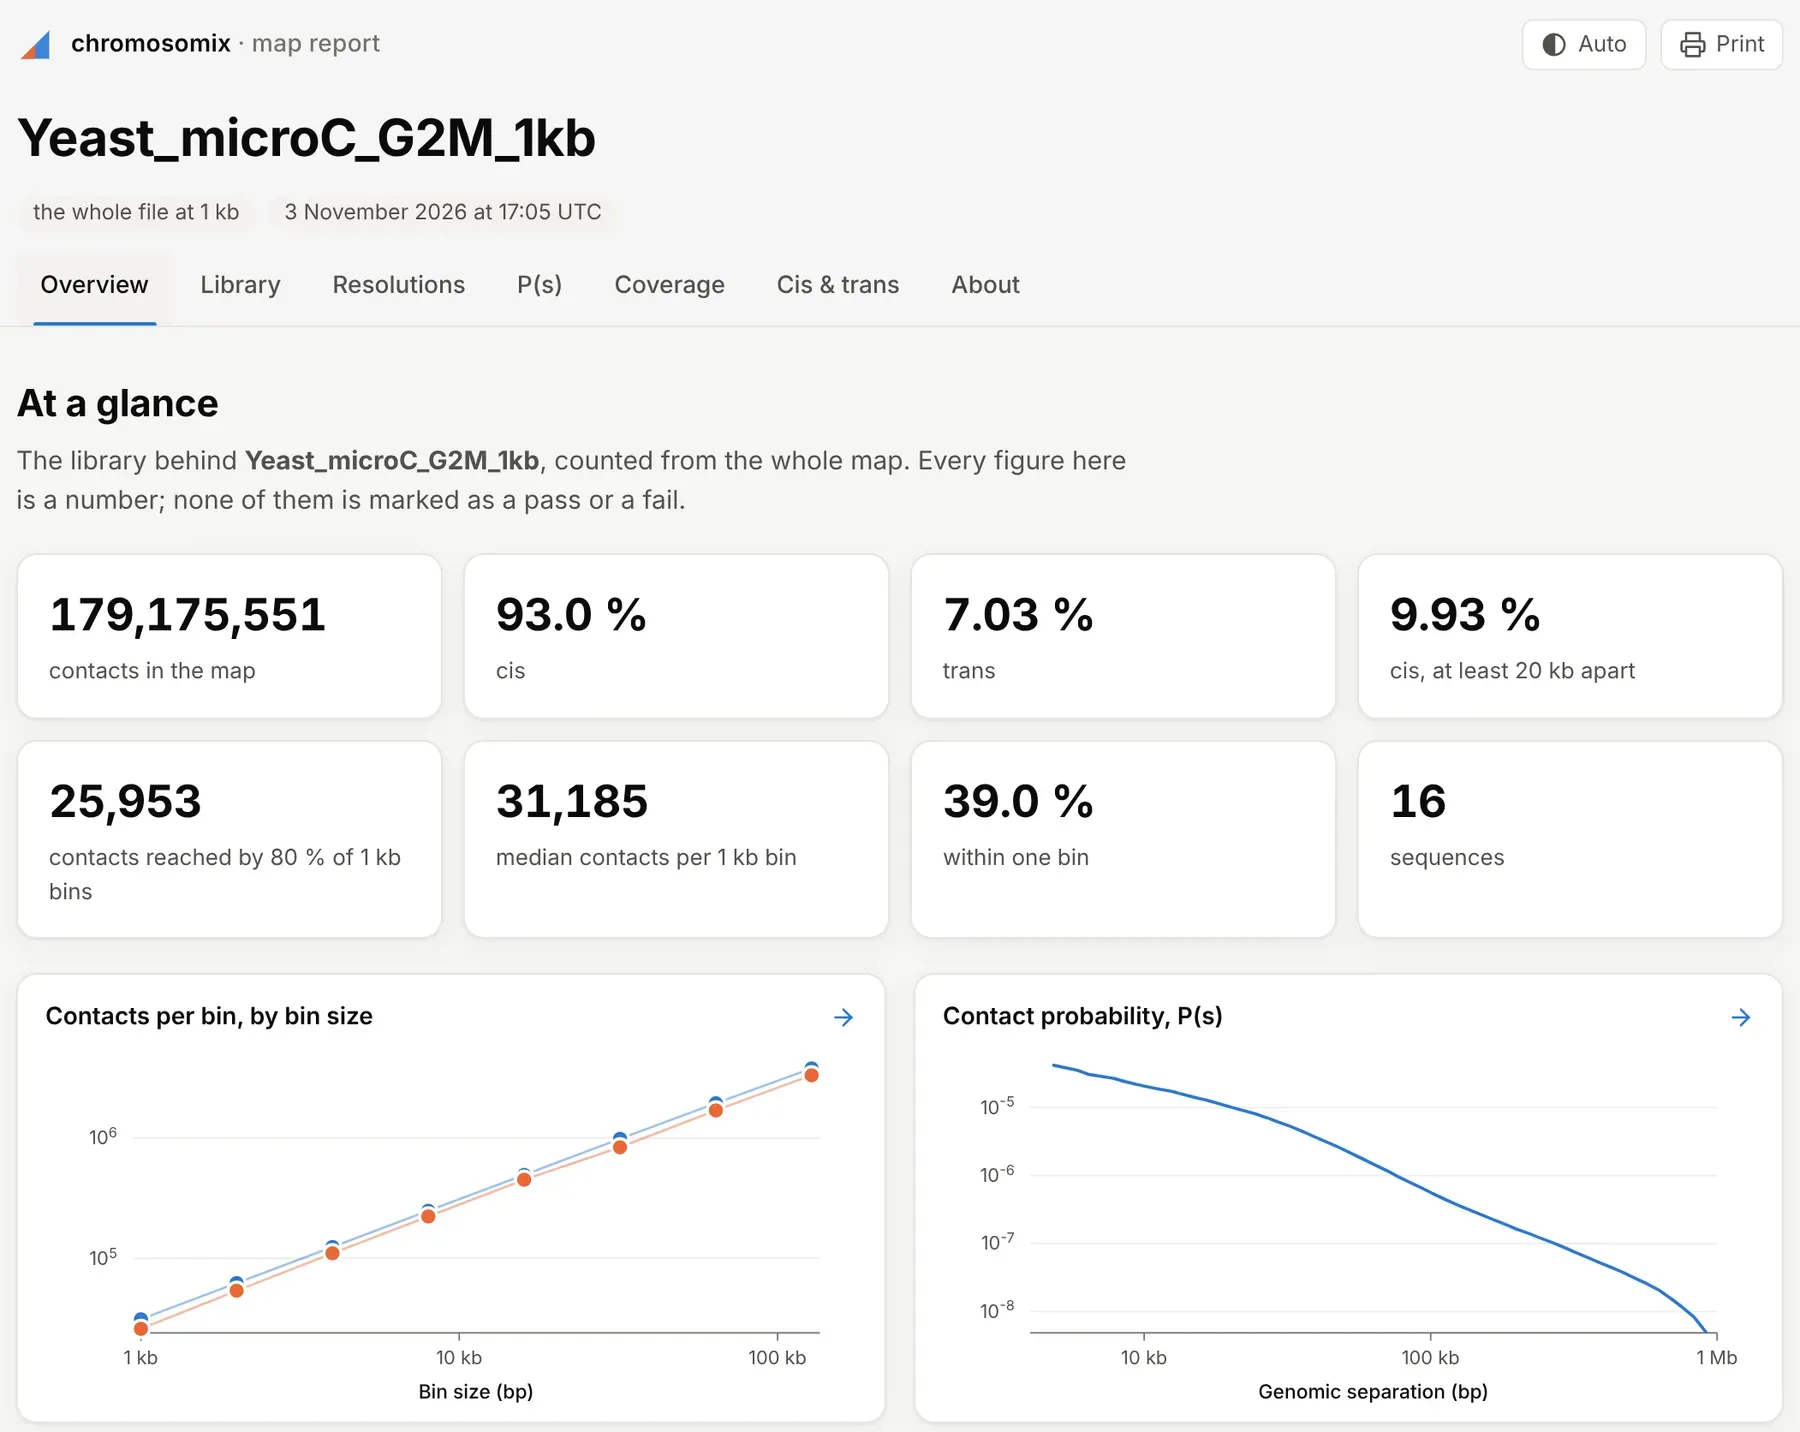
Section titled “Running it”Open the map, choose Map report in the 2D tasks card of the Analysis panel, and press run. It runs P(s) over the whole genome, balanced where the file has weights, and Coverage and marginals and Cis and trans per sequence on the raw counts, reusing a run already in hand with the same settings. The drawer shows the tables and figures; HTML report, beside copy provenance, saves the whole run as one page.
The same run from a shell, which also writes the MultiQC sections:
chromosomix mapreport <map> [--<parameter> <value> …] --out <dir>For a batch, run it once per file into one folder and point MultiQC at it, for one report with a row per library:
chromosomix mapreport rep1.mcool::/resolutions/1000 rep2.mcool::/resolutions/1000 --out qc/multiqc qc/Parameters
Section titled “Parameters”ladder from sets the resolution the library’s totals and the ladder are counted at: the file’s finest resolution, the default, whatever is on screen, or this map’s resolution. A map binned from a .pairs is its own finest. The other three tasks run on the map as it is open.
| Parameter | Takes | Default | What it does |
|---|---|---|---|
ladder from--base <value> | finest or map | finest | The resolution the library is counted at and the ladder climbs from. finest — where the file stores more than one, its finest is read for the ladder, whatever is on screen; map — this map’s resolution. |
use balancing weights--no-balance | a switch | On wherever the file carries balancing weights; --no-balance reads the raw counts. | — |
What it writes
Section titled “What it writes”- table: a table: TSV
- curve: a curve: TSV
- HTML report:
<file stem>.mapreport.report.html - MultiQC summary:
<file stem>.mapreport.summary_mqc.tsv(written by the command line only) - MultiQC resolutions:
<file stem>.mapreport.resolutions_mqc.tsv(written by the command line only) - MultiQC contacts per bin:
<file stem>.mapreport.resolution_mqc.json(written by the command line only) - MultiQC P(s):
<file stem>.mapreport.ps_mqc.json(written by the command line only)
On the command line every file goes into --out as <file stem>.mapreport.<output>.<ext>, and each TSV opens with # lines naming the build, the file and every parameter that produced it.
MultiQC’s general statistics are the contacts, the cis, trans and cis ≥ 10 kb shares, and the finest bin’s median and 80 % count.
Reading the result
Section titled “Reading the result”The library
Section titled “The library”The library gives every contact, the cis and trans shares, the share within one bin, the cis contacts between bins at least 1, 2, 4, 10, 20 and 40 kb apart (pairtools’ separations, between bin starts, so coarse at bins over 1 kb), and the pixels with a count. A map binned from a .pairs adds pairtools stats’ own counts: pairs, mapped, duplicates, unique, cis, trans, and cis at the same separations.
The resolutions
Section titled “The resolutions”The ladder runs from the coarsest bin size to the finest: every stored multiple of the base, and the base doubled until it passes a tenth of the longest sequence. At each size it gives the bins, the mean and median contacts per bin, Reached by 80 % of bins (the largest count four bins in five hold), and the shares of bins that are empty and that hold under a tenth of the median. Contacts per bin, by bin size draws the median and the 80 % count against the bin size.
For the map resolution of Rao et al. (2014), the finest bin size at which 80 % of bins hold at least 1,000 contacts, read down Reached by 80 % of bins to the last size at 1,000 or more. The report marks no pass or fail: the cut is yours.
A contact counts at both its ends, as in Juicer’s calculate_map_resolution.sh, so a coarser bin is the sum of its finer ones, and a contact within one bin counts twice where the coverage task counts it once.
The rest of the page
Section titled “The rest of the page”- P(s) and its slope, and Cis and trans per sequence, are those tasks’ own.
- Coverage along the genome is the total coverage, sequence after sequence in the file’s order, averaged over a few bins on a large genome. Spread of coverage shows how many bins hold how much, with the empty bins counted in the notes.
The HTML report
Section titled “The HTML report”One file that fetches nothing, so it opens anywhere, with a tab per question: Overview, with headline tiles and thumbnails of the ladder and P(s); Library; Resolutions; P(s); Coverage; Cis & trans; and About, with the run’s notes and provenance. Figures save as SVG or TSV, tables sort by a click and save as TSV, and each tab prints on a page of its own.
Documentation of chromosomix v0.20.0 · built from 40ec1ec · source