Tracks and features
Dropped on a map, a track is drawn along any of the map’s four edges; opened with no map, it opens the 1D browser over its genome (The genome browser). Each track is a row of the Annotations panel’s Tracks card, whose Load a track zone takes a drop or a click.
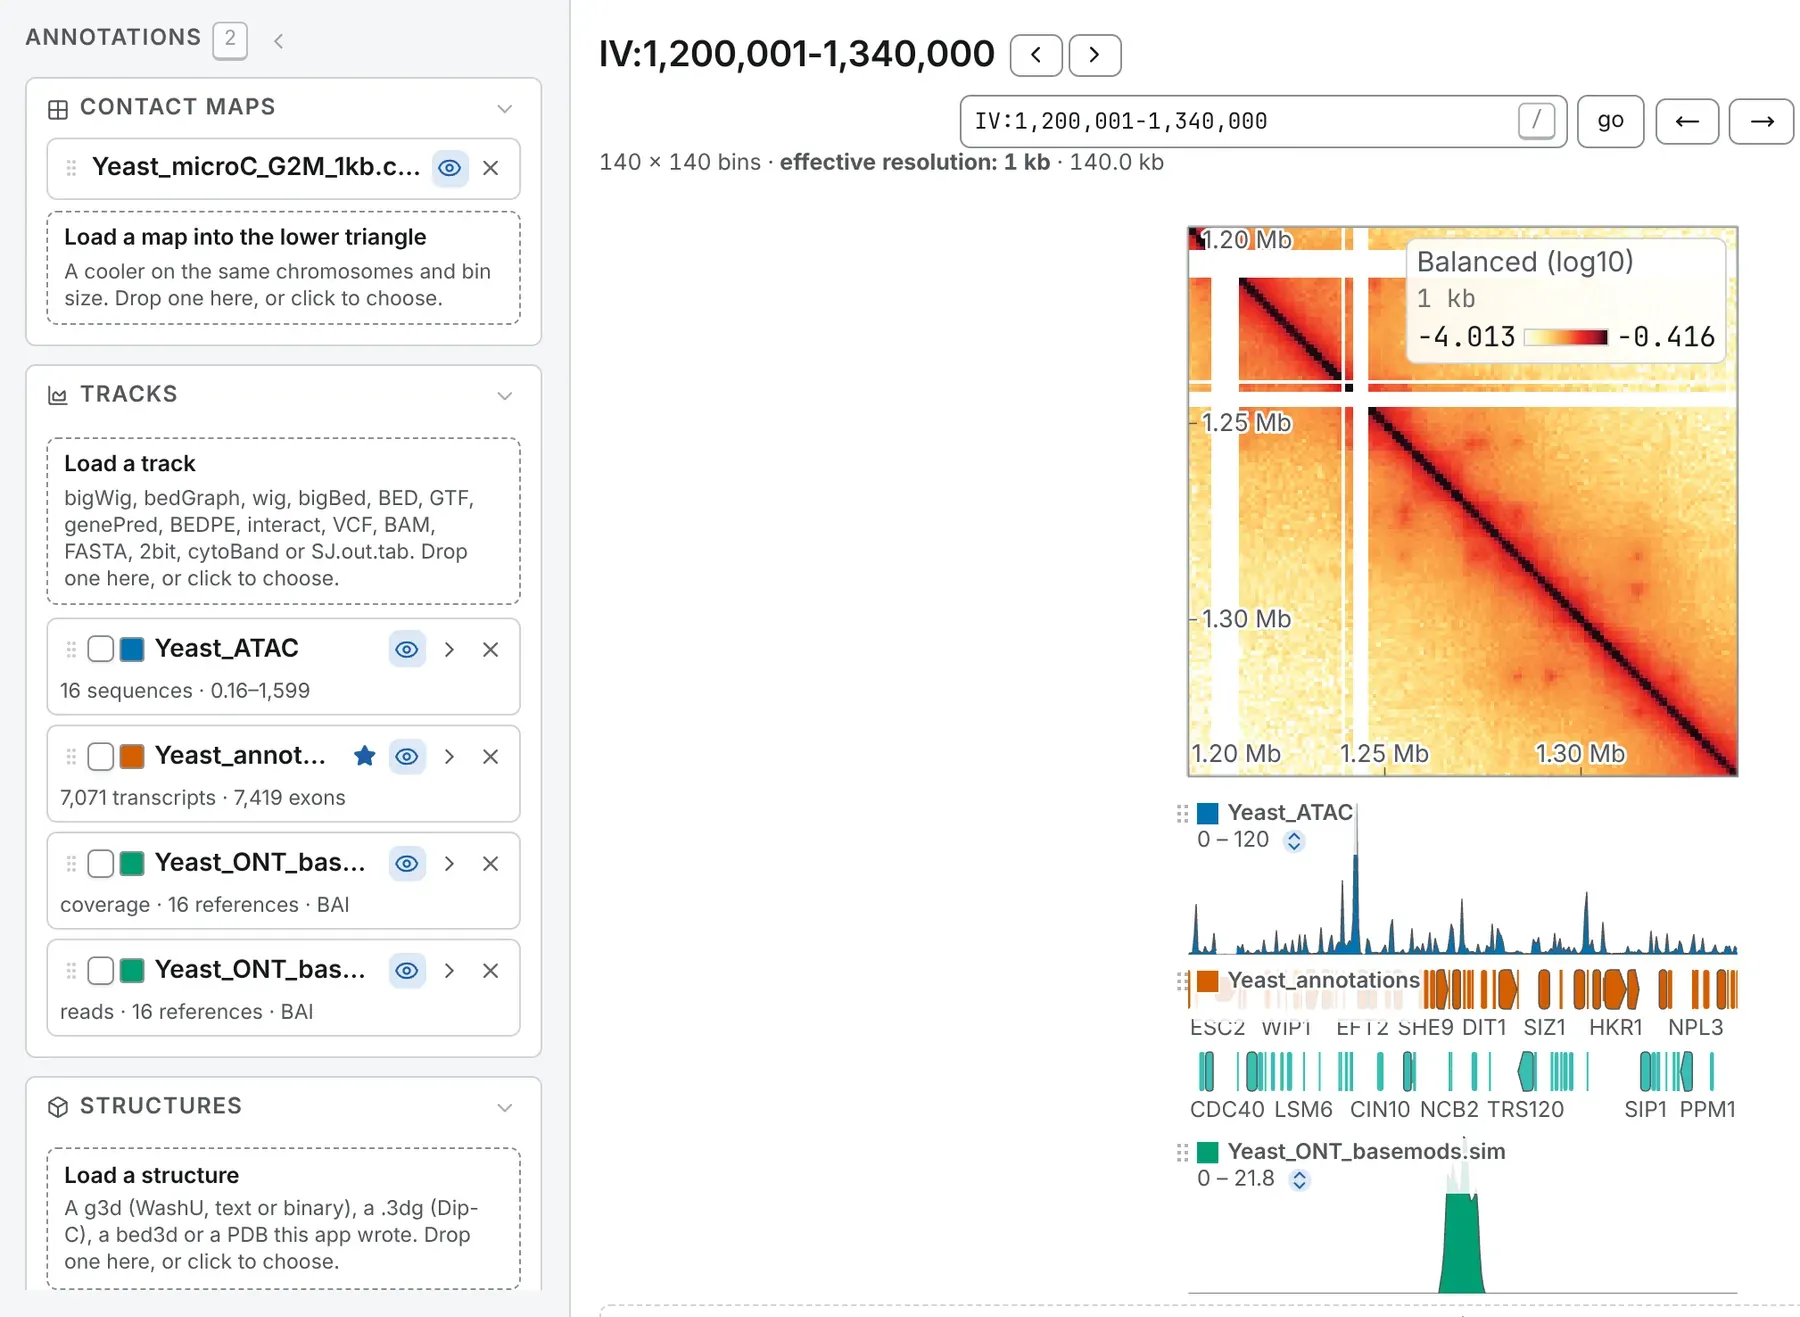
Sequence names are matched to the map’s even when spelled differently (chr1 against 1), and the
row says when some do not match: 10 of 16 sequences matched; nothing is drawn on XI, XII, …. Pairs
of loci are on Interactions; FASTA and .2bit on
Reference sequences.
Signal: bigWig, bedGraph and wig
Section titled “Signal: bigWig, bedGraph and wig”A bigWig, a bedGraph (exactly four columns, the fourth a number, or a track type= line) or
a wig (fixedStep or variableStep lines, 1-based) draws as a value track with its own limits, colour
and style, and can share an axis with others. A bedGraph or a wig is read whole.
Intervals: BED and bigBed
Section titled “Intervals: BED and bigBed”A BED of 3, 4, 5, 6, 9 or 12 columns, a narrowPeak, broadPeak or gappedPeak, or a headed table whose first three columns are a sequence, a start and an end opens as features beside the map, never on it. A BED12’s blocks are drawn as exons, its thick span thicker.
A bigBed is read whole, and cut off, with a note, past a million intervals. One whose schema says bigGenePred, bigBarChart, bigMethyl or bigInteract is read as that.
Gene models: GTF, GFF3 and genePred
Section titled “Gene models: GTF, GFF3 and genePred”GTF and GFF3 are read as transcripts from their exon and CDS rows, the coding span thick and
the untranslated ends thin. A bacterial GFF3 from Prokka, Bakta or DFAST, whose rows name no parent,
is read a feature per row, under its locus_tag and gene symbol.
genePred, genePredExt and refFlat open as the same gene models, with or without a
leading bin column, and so does a bigGenePred. With several gene models loaded, the star on a
row marks the one the locus box searches for gene names.
Called variants: VCF
Section titled “Called variants: VCF”A VCF opens as a lane of called variants: a substitution in the colour of the base it changes
to; an insertion, a deletion or a symbolic allele (<DEL>, <DUP>) in grey, as wide as it is, from
INFO/END or INFO/SVLEN. Click a variant for its card.
- With
##contiglines in its header, it opens the 1D browser on its own chromosomes, at their exact lengths. - Samples are counted, not drawn: 1,284 variants · 2,504 samples not drawn.
- It is read into memory, so one human sample’s whole-genome calls are too large; split by
chromosome, they open. BCF is not read:
bcftools viewwrites a VCF.
Reads: BAM
Section titled “Reads: BAM”A BAM opens as two rows:
- the depth row, under the file’s name: mean depth, a deletion counted as covered and a skipped intron not, secondary and supplementary alignments left out, duplicates kept unless you switch on hide duplicates;
- the reads row, name · reads, in the 1D browser only: the pile of reads.
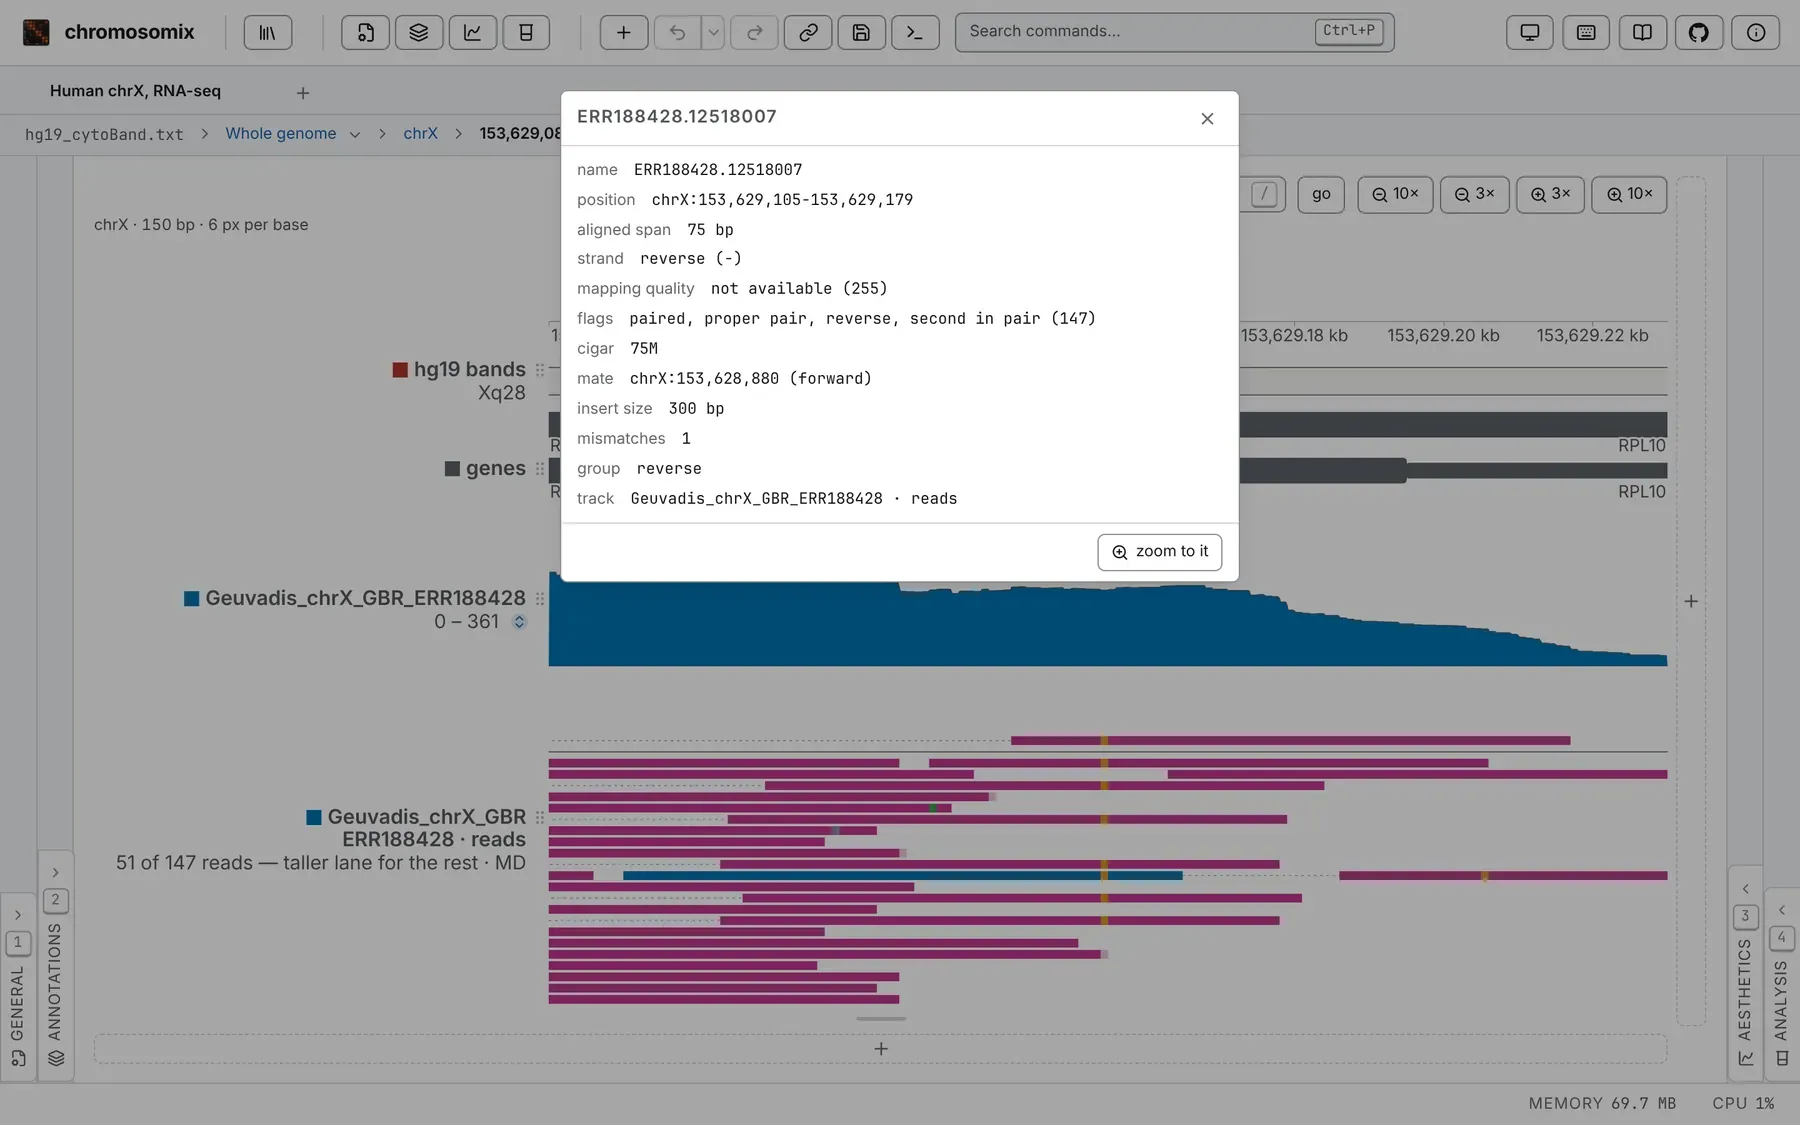
min MAPQ and hide duplicates apply to both rows; the colouring, the layout of pairs and
split reads to the pile. Mismatches are coloured from the reads’ MD or =/X codes, or from
a FASTA open in the tab; base modifications from the MM and ML tags (colour by → base
modification on the pile, % modified on the depth row). A spliced library’s skipped introns are
drawn as arcs over the depth (junction arcs, from two reads by default).
Without a .bai or .csi, the reads are found by searching the sorted file, a window of up to 4 Mb
at a time (reads located by search). A window too deep to read, or a pile over too wide a window,
draws nothing and says why: 12.4 MB of reads — zoom in.
A BAM must be sorted by coordinate: one sorted by read name, or a Hi-C pipeline’s alignment file, is refused with the fix:
samtools sort -o sorted.bam reads.bamsamtools index sorted.bamFor Hi-C, open the .pairs or the contact map instead. CRAM is not read: convert it with
samtools view -b.
Methylation: bedMethyl and bigMethyl
Section titled “Methylation: bedMethyl and bigMethyl”A bedMethyl (from modkit pileup, or ENCODE’s older WGBS layout) or a bigMethyl opens as
percentage modified per base, on a 0 to 100 axis at first. Where several modifications cover the
same bases, the commonest is drawn, and the lane’s summary lists every code (m 5mC, h 5hmC, a
6mA…) with its count of rows. A row with no reads is left out, not drawn as 0 %.
Charts: barChart and bigBarChart
Section titled “Charts: barChart and bigBarChart”A barChart gives each feature a vector of values: a small bar chart where there is room,
otherwise one box in its top category’s colour and height. Names and colours come from the track
line (barChartBars, barChartColors); a bigBarChart opened alone has none, so its categories
are numbered.
Charts on a lane share one ceiling, the file’s maxLimit or its largest value. scale each chart
scales each to its own tallest bar; typed limits fix the axis, to compare two files. Click a feature
for its whole chart.
Ideograms: cytoBand
Section titled “Ideograms: cytoBand”A cytoBand or cytoBandIdeo draws each chromosome’s Giemsa bands. The line under the lane
names the bands in view (Xq27.3 – q28), a click names one (Xq28), and the locus box finds bands
by name. A cytoBand that tiles every chromosome declares the genome: UCSC’s hg19_cytoBand.txt
alone opens the browser over hg19.
Splice junctions
Section titled “Splice junctions”Junctions are drawn as a sashimi plot’s arcs, each labelled with its read count, from three files:
| File | Written by | Recognised by |
|---|---|---|
SJ.out.tab |
STAR | its nine integer columns |
| a junctions BED12 | regtools, TopHat, Portcullis | junc or sj in its name, a TopHat track line, or JUNC… row names |
.junc |
leafcutter | its name |
Each junction’s card shows the file’s other columns, which can also colour the lane: colour by annotated to see novel splicing. Junctions on both strands split the lane, forward above, reverse below. The lane’s lower limit filters, as a sashimi plot’s minimum junction coverage does. A spliced BAM draws its own arcs (above).
Lengths: chrom.sizes
Section titled “Lengths: chrom.sizes”A chrom.sizes (or a .genome file: a name and a length per line) declares a genome. Opened
alone, it starts the 1D browser on those sequences. Dropped on a browser whose lengths were guessed
from a feature file (inferred (rounded up) on the Genome card), it gives the real ones.
Reading part of a large text file
Section titled “Reading part of a large text file”Text formats are read whole, unless bgzipped and indexed with tabix: then only the sequences the map holds are read.
sort -k1,1 -k2,2n peaks.bed | bgzip > peaks.bed.gztabix -p bed peaks.bed.gzKeep the .tbi beside the file, drop the two together, or name it with #index=<address>. Without
a usable index, or where it would save less than a fifth of the file, the whole file is read. A
browser holds little more than half a gigabyte of text: index a larger file, or split it by
chromosome.
The file’s own columns
Section titled “The file’s own columns”A feature lane is coloured by strand at first. Its colour by offers the file’s other columns (a
GTF’s biotype, a VCF’s QUAL, a BED’s name…) as categories, commonest first, or, for numbers, as
a colour ramp over the whole file’s range. Names exactly A and B take the compartments’ red and
blue.
The Metadata annotations card, folded at the foot of the Annotations panel, offers a cooler’s own columns, such as its balancing weight, where the view can show them. Pick one and press add to draw it as a lane, numbers as bars and labels as runs of colour; its row exports it as a TSV.
Documentation of chromosomix v0.20.0 · built from 40ec1ec · source