Metaplot over a feature set
- In the app
- Analysis panel, under 1D tasks: Metaplot over a feature set
- Command
chromosomix metaplot- Reads
- Tracks and interval files, with or without a contact map
- Also known as
- profile, aggregate, average, TSS, deeptools
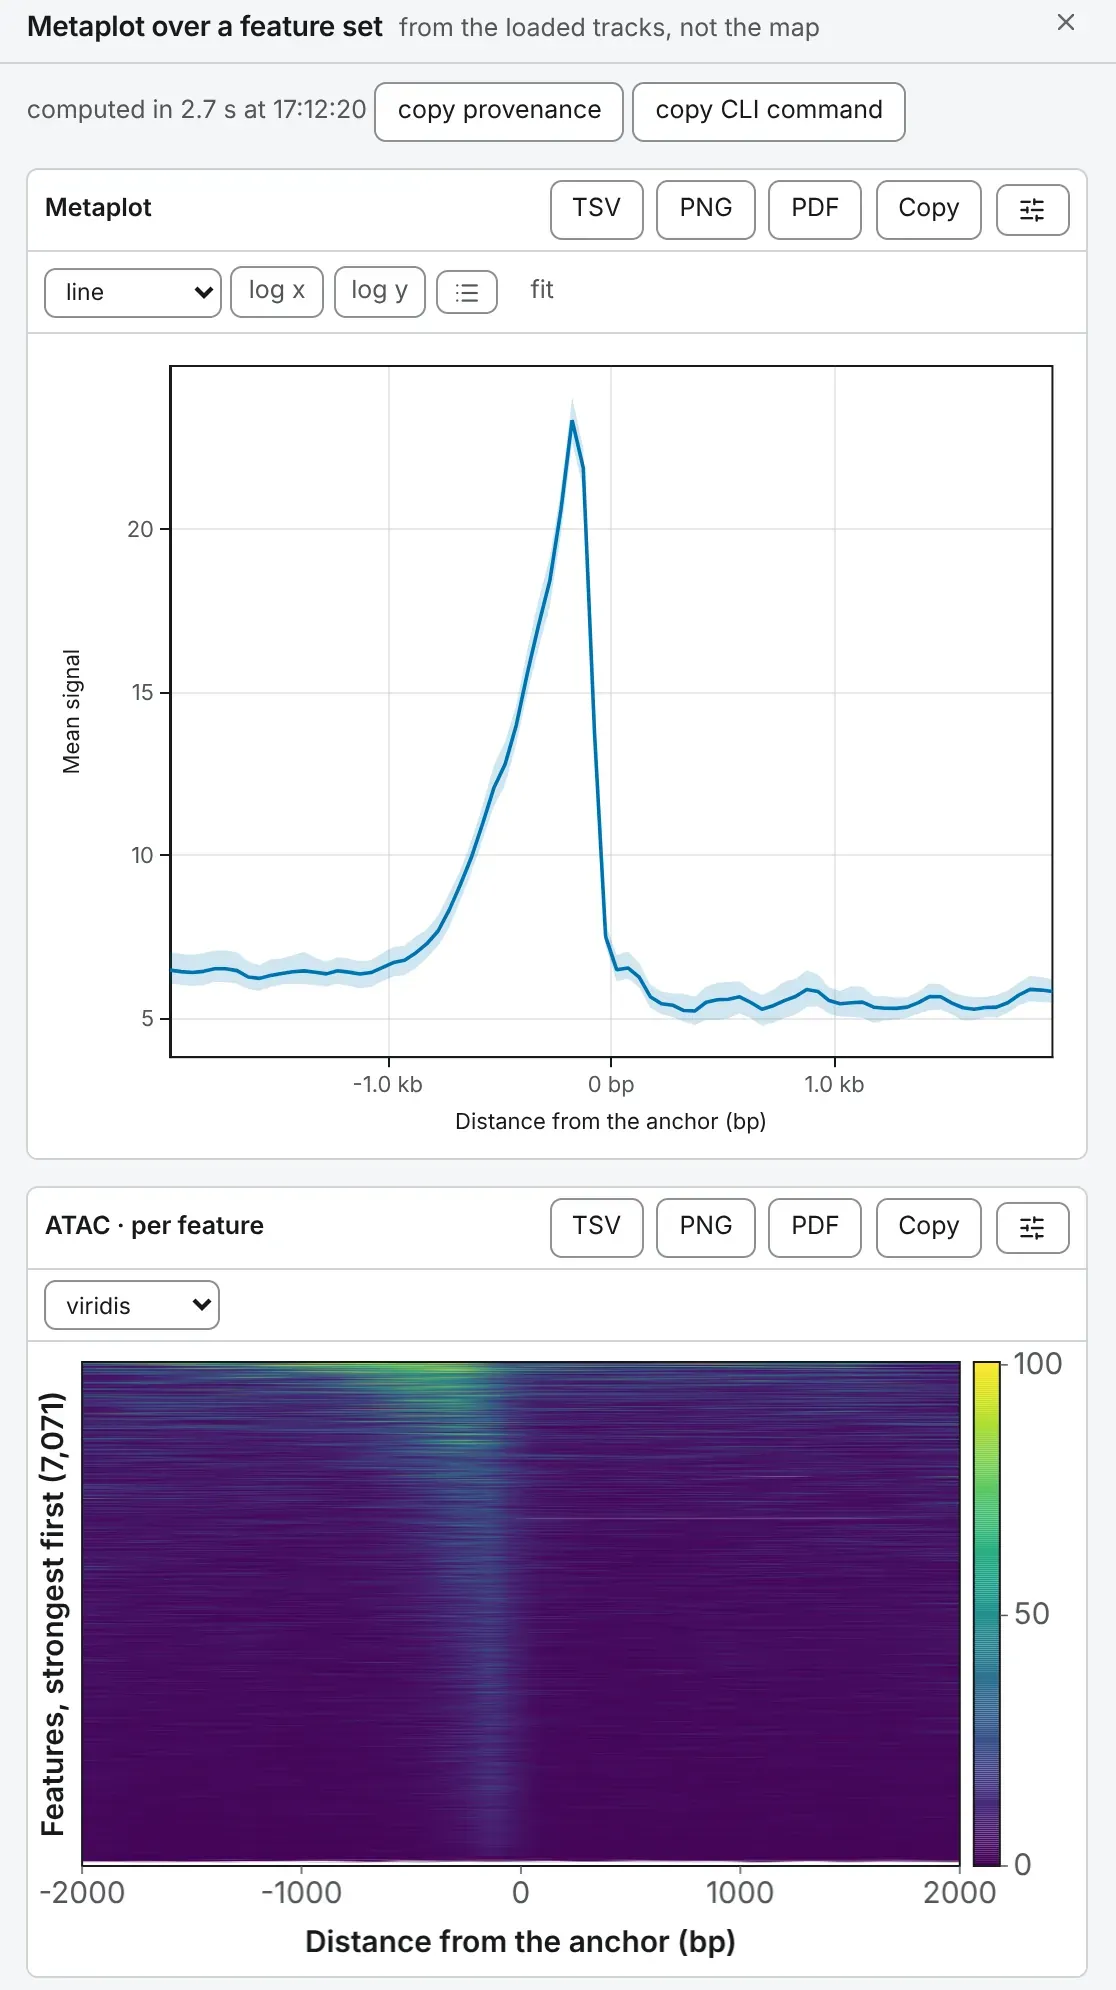
Metaplot over a feature set averages one or more tracks in a window about every feature of a set, such as ATAC-seq about every transcription start site, into a profile with a band, over a heatmap of every feature.
Running it
Section titled “Running it”Load one or more tracks and a feature set, such as a BED, narrowPeak or GTF (Tracks and features). Open Metaplot over a feature set on the 1D tasks card of the Analysis panel, tick the tracks and choose the features; no map is needed. The drawer shows a line per track, and per group when you rank the set into groups, each over its heatmap.
The same run from a shell:
chromosomix metaplot [<map>] --tracks <tracks.bw> --features <features.bed> [--<parameter> <value> …] --out <dir>Parameters
Section titled “Parameters”mode chooses the window. reference point is a fixed flank either side of each feature’s start, centre or end, under anchor on, in columns resolution base pairs wide. scaled region resamples every feature’s body to body columns columns between its flanks, so features of every length share one axis. Leave respect strand on for anything stranded, or an asymmetric signal cancels itself out.
rank by sorts the features by a numeric column of the set, and then draws one line, the top N, the bottom N, or K groups of equal size: the check that the strongest features look like something and the weakest like nothing. z-score tracks first puts tracks in different units on one axis.
| Parameter | Takes | Default | What it does |
|---|---|---|---|
| General | |||
tracks--tracks <file,…> | files: a signal track | — | — |
features--features <file> | a file: a feature set | — | — |
mode--mode <value> | reference or scaled | reference | reference — a fixed flank around one point; scaled — every feature body resampled to one width. |
anchor on--at <value> | start, centre or end | start | — |
flank--flank <n> | a number, at least 0, in bp | 2000 | Read this far either side of the anchor. |
resolution--step <n> | a number, at least 1, in bp | 50 | One column of the plot per this many base pairs. |
body columns--body <n> | a whole number, at least 10 | 100 | Read only under other settings of this task. |
respect strand--stranded / --no-stranded | on or off | on | A minus-strand feature is read right to left, or an asymmetric signal cancels itself. |
| Ranking | |||
rank by--rankBy <column> | a numeric column of the set --features names; optional | not used | — |
then--subset <value> | all, top, bottom or groups | all | all — rank only; still one average; top — top N; bottom — bottom N; groups — one line per equal-sized group. Read only under other settings of this task. |
N--count <n> | a whole number, at least 1 | 500 | Read only under other settings of this task. |
groups--groups <n> | a whole number, 2 to 10 | 4 | Read only under other settings of this task. |
| Summary | |||
z-score tracks first--zscore / --no-zscore | on or off | off | Centre and scale each track by its own mean and SD over this run’s windows, so tracks in different units share one axis. |
average--average <value> | mean, median or trimmed | mean | — |
band--band <value> | bootstrap, sd or none | bootstrap | bootstrap — bootstrap CI; sd — SD. |
bootstrap draws--iterations <n> | a whole number, 20 to 2000 | 200 | — |
seed--seed <n> | a seed, a whole number | 1 | The same seed gives the same band twice. |
per-feature heatmap--heatmap / --no-heatmap | on or off | on | The mean of a bimodal set is a line that describes nothing. |
What it writes
Section titled “What it writes”- curve: a curve: TSV
- matrix: a matrix, a pileup or a heatmap: TSV
On the command line every file goes into --out as <file stem>.metaplot.<output>.<ext>, and each TSV opens with # lines naming the build, the file and every parameter that produced it.
Reading the result
Section titled “Reading the result”The profile
Section titled “The profile”Each column is the average, over the features that reach it, of the track’s mean over the column’s bases; a feature with no value there is left out of that column, never counted as zero. The x axis is the distance from the anchor in base pairs. In a scaled window it is marked Start and End where every feature’s body begins and ends; between them, the share of the way through the body (25%, 50%, 75%, or tenths); outside them, the distance from the nearer edge, -1 kb before the start and +1 kb after the end, as deepTools labels the same plot. A wider figure or a window wheeled into one part of the axis takes finer steps, and the pointer reads positions the same way (37.4%, -150 bp). The heatmap under it marks the flanks’ ends, Start, 50% and End where they fall.
The band is by default a 95 % bootstrap interval over the features: how sure the average is. SD draws the spread of the features instead, how alike they are. A median or a trimmed mean, of the middle 80 %, keeps a few extreme features from carrying the line.
The heatmap
Section titled “The heatmap”One row per feature, strongest first by its mean over every column of every track, in the same order in every heatmap of the run. Colours run from zero to the 99th percentile, symmetric about zero for a track that goes negative, so one extreme feature does not wash out the rest; a feature no track covers sits at the bottom.
Read it before the line: a line that averages a strong block of rows and an empty one describes neither, and ranking the set into groups shows both.
What to watch for
Section titled “What to watch for”- In a scaled window, a feature shorter than the number of body columns, or whose window is clipped away at a sequence end, is dropped; a note says how many.
- Near the end of a sequence a reference-point window is clipped: the columns past the end are empty.
- Every feature is a row, so a gene whose GTF transcripts share a start counts once per transcript.
Compared with deepTools
Section titled “Compared with deepTools”The columns are computeMatrix‘s: in the validation, the profile and every heatmap row are deepTools’, within the two tools’ rounding. The one difference is where the rows no track covers go: last here, first in deepTools.
Documentation of chromosomix v0.20.0 · built from 40ec1ec · source