Figures and export
A map, the 1D browser, a deck, a 3D model or an analysis figure can each be saved as a figure, redrawn for the file rather than captured from the screen, and on white even in the dark theme.
Saving a view
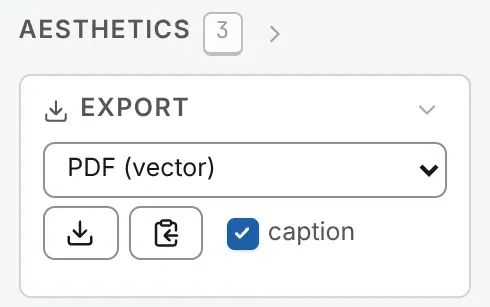
Section titled “Saving a view”The Export card, first in the Aesthetics panel (3), has a resolution, a format, a save button, a copy button and a caption switch.
- PDF (vector), the default: the axes, labels, tracks, key and caption are paths and text, set in Helvetica, that you can restyle in a vector editor; a map’s cells are one lossless image. The 1D browser’s PDF is paths and text throughout.
- PNG: 96 (the screen), 150, 300 (the default, for print) or 600 dpi.
The figure is framed as the screen is; the map’s legend switch removes the key. The caption under it says what the figure shows, from the region and the file to the colour range and the date; its switch holds for the map, the 1D browser and the deck at once.
From anywhere, S saves the figure as the card is set, and Ctrl+C (⌘C on a Mac) copies it as a PNG at the card’s resolution, unless text is selected or the caret is in a box. The copy button always copies a PNG.
The file is named after the region, such as IV_1000001-1400000-<stamp>.pdf. Chromium-based
browsers open your system’s save dialog for it; Firefox and Safari download it. The
console records every file written.
Several maps as one figure
Section titled “Several maps as one figure”With maps side by side, the deck’s bar has a save button, Save the whole deck as one figure, laid out as it is on screen, for a PNG at 300 dpi, and a copy button for the same picture; Ctrl+C copies it too. Once a cell beside the first map has a picture of its own, the Export card and S save the whole deck in the card’s format and resolution. In its PDF each cell keeps its own caption, key and frame.
Copy this: one object alone
Section titled “Copy this: one object alone”Copy this, in the right-click menu of the map, a lane or a 3D model, copies that object alone as a PNG at the screen’s resolution, on white, with no axis, key, mark, name or frame: a piece for a figure you build elsewhere.
A 3D model
Section titled “A 3D model”The 3D structure card has the same export row, and the model’s coordinates leave as a bed3d or a PDB from its row on the Structures card (Exporting a model).
A task’s figure
Section titled “A task’s figure”Every figure in the Analysis drawer is drawn from the task’s numbers and your choice of style. Restyle it freely: the numbers do not move, and the export draws what you see.
The strip and the exports
Section titled “The strip and the exports”A slim strip over the figure holds, over a curve, the mark (line, area, step, points, bars, histogram, box or violin), the two log axes, the legend and fit, which puts both axes back to the whole of the data; over a matrix, its colour map; over a table, a box that filters its rows. Beside the title are the exports: TSV (and bigWig and bedGraph for a track), PNG at 300 dpi, PDF, a true vector page, and Copy, the PNG on the clipboard.
Zooming the figure
Section titled “Zooming the figure”The wheel zooms the horizontal axis (with Shift, the vertical) and a drag pans it. Hold ⌘ (Ctrl elsewhere) and drag a box to zoom to it, or flick across or down to set one axis. A double-click puts both axes back to the windows the controls last set. The PDF and the PNG draw what you zoomed to.
Customise this figure
Section titled “Customise this figure”Customise this figure, the sliders button beside the exports, opens the figure at the size of the window, with a column of cards you can resize or hide:
- chart: the mark, line width, point size, smoothing, fill under the line, the band round each line where the task computed one, and a histogram’s bins;
- axes: each axis’s scale (linear or log), name, window and grid;
- series: an eye and a swatch for each series, show all and reset colours;
- text: a title printed on the figure, the type size, where the legend goes, and the tooltip;
- colour, for a matrix: its colour map and the values its scale runs between;
- rows, for a table: a filter, the column to sort by, the columns to show, and plot, which draws two of its columns as a chart.
reset goes back to the task’s figure. Your choices are kept for that file, task and figure, through a rerun, a reload and a saved workspace. On paper, a hidden series is left out of the legend.
What an export carries
Section titled “What an export carries”Every result keeps a record of its task and the task’s version, every parameter, the view, the file,
the app’s version and commit, and the time. copy provenance under a finished result copies it, and
copy CLI command the chromosomix command that repeats the run.
- Every task output offers TSV: the figure’s numbers under that record, as
#lines. A bedGraph opens with it too, and leaves out the bins with no value rather than writing them as 0; a bigWig has no room for the record, so save the TSV beside it. - A called set’s BED and a model’s bed3d open with a
#line naming what they hold, what it came from and when; a model’s PDB has a TITLE saying the same. - A map’s or the 1D browser’s figure carries its caption, if you leave it on, and every PDF names the chromosomix version in its document properties.
Tracks, called sets, marks, the file’s own columns and 3D models also leave as bigWig, bedGraph, BED, BEDPE, bed3d or PDB: Annotations and bookmarks lists which, and where each button is. The map report also leaves as one HTML report of every figure and table of its run, with its notes and provenance.
Documentation of chromosomix v0.20.0 · built from 40ec1ec · source