Track correlation
- In the app
- Analysis panel, under 1D tasks: Track correlation
- Command
chromosomix trackcorr- Reads
- Tracks and interval files, with or without a contact map
- Also known as
- Pearson, Spearman, compare tracks
Do two replicates agree? Does an insulation score follow a ChIP-seq track? Track correlation gives the correlation of every pair of the tracks you choose, over fixed windows along the genome or over the features of a set.
Running it
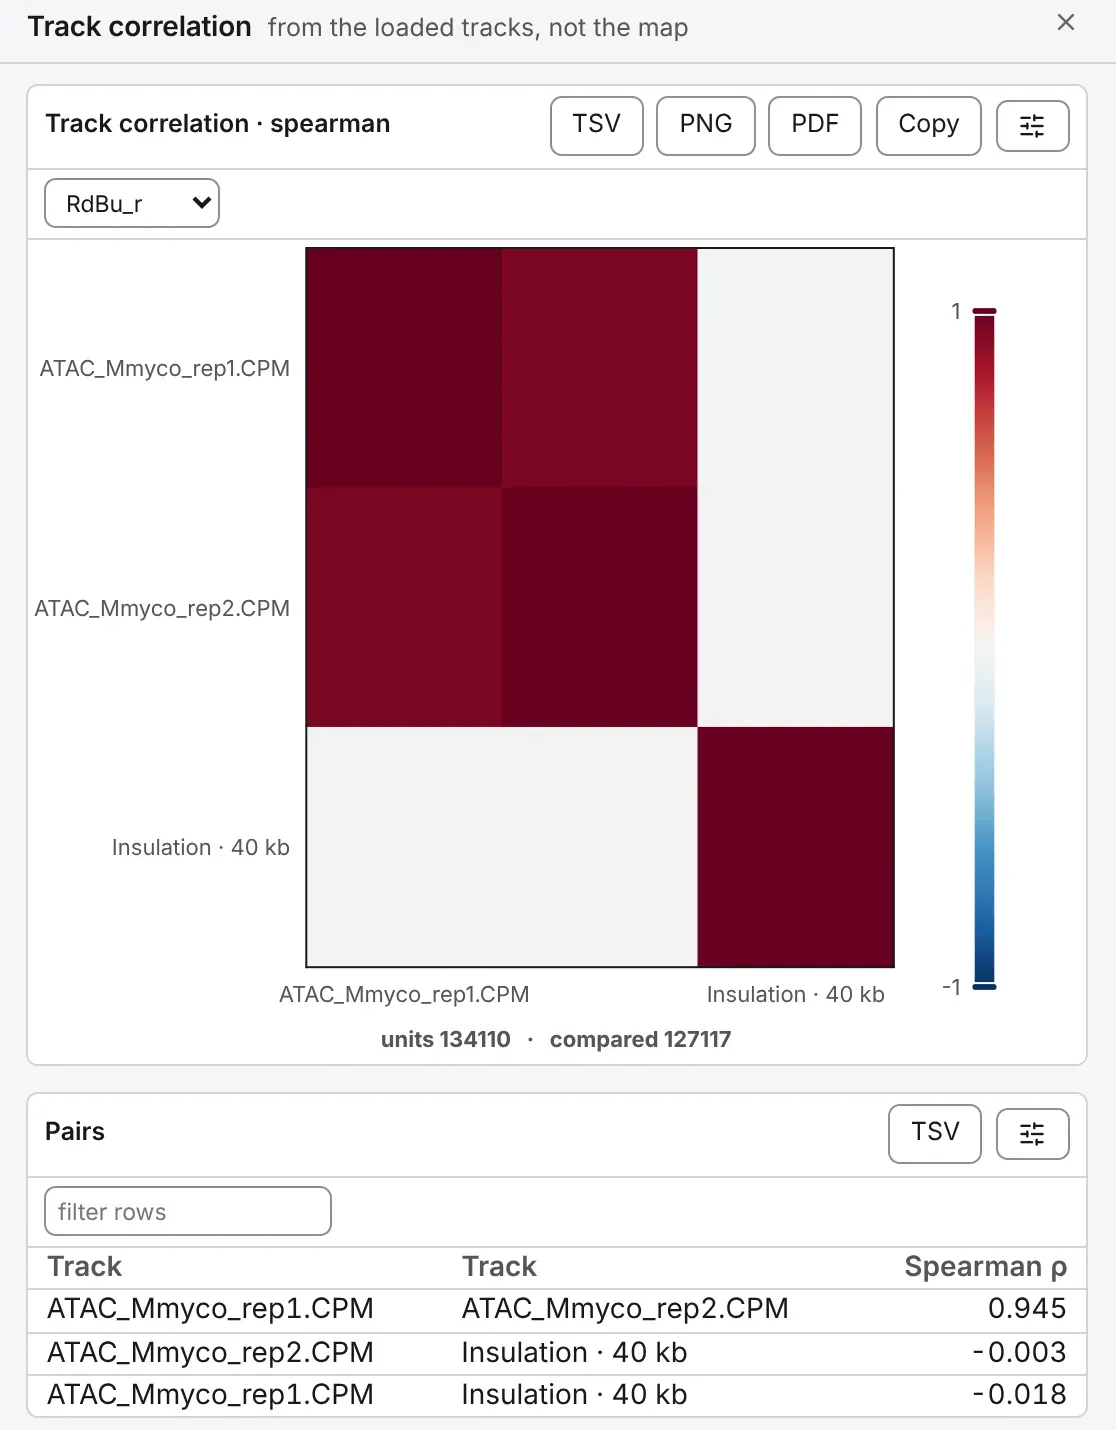
Section titled “Running it”Load two or more tracks (Tracks and features), open Track correlation on the 1D tasks card of the Analysis panel and tick the tracks; no map is needed. The drawer shows the correlation matrix, on a colour scale centred on 0, and Pairs, every pair from the most correlated to the least.
The same run from a shell:
chromosomix trackcorr [<map>] --tracks <tracks.bw> [--<parameter> <value> …] --out <dir>Parameters
Section titled “Parameters”compare over is the question. fixed windows asks whether the tracks agree everywhere, an answer the empty majority of the genome dominates; a feature set asks whether they agree where something is happening, usually what was meant. window, 100 bp by default, is the width at which a coverage track says something about a peak; wider windows smear a peak into its neighbourhood. method is Spearman by default, which ranks the values first, so one very deep locus cannot carry the coefficient; Pearson correlates the values themselves.
| Parameter | Takes | Default | What it does |
|---|---|---|---|
tracks--tracks <file,…> | files: a signal track | — | — |
compare over--over <value> | bins or features | bins | bins — everywhere, including the empty majority; features — only where something is happening. |
window--binsize <n> | a whole number, at least 1, in bp | 100 | — |
features--features <file> | a file: a feature set | — | Read only under other settings of this task. |
method--method <value> | spearman or pearson | spearman | spearman — rank-based; robust to one very deep locus; pearson — pearson. |
What it writes
Section titled “What it writes”- matrix: a matrix, a pileup or a heatmap: TSV
- table: a table: TSV
On the command line every file goes into --out as <file stem>.trackcorr.<output>.<ext>, and each TSV opens with # lines naming the build, the file and every parameter that produced it.
Reading the result
Section titled “Reading the result”A coefficient near 1 is two tracks that rise and fall together; near 0, no relation; below 0, one is high where the other is low. Each unit’s value is the exact mean over the bases the track has a value for, and over fixed windows each sequence’s last, shorter window is left out.
A unit any one track lacks is left out of every pair, as in deepTools’ plotCorrelation, so every coefficient is over the same units: one track with gaps, such as an insulation score where the map was sparse, narrows every pair. The note says how many units were left out, and compared beside units under the matrix how many are left; with fewer than three, no pair has a coefficient. To compare two tracks over everything they share, run them on their own.
Compared with deepTools
Section titled “Compared with deepTools”The validation holds the coefficients to pyBigWig’s exact window means. deepTools reads a window’s mean from a zoom level where the file has one fine enough, which moves its coefficients at the wider windows; at 100 bp it agrees to the digits it writes, hence equivalent rather than identical.
Documentation of chromosomix v0.20.0 · built from 40ec1ec · source