Model versus map
- In the app
- Analysis panel, under 3D tasks: Model versus map
- Command
chromosomix structuremap- Reads
- A contact map
- Also known as
- 3D, structure, distances
Beads close together in a 3D model should have been caught together often on the map. Model versus map sets the model’s distances against the map’s contacts, as pictures and as one number per sequence, so you can judge a model before reading anything off it.
Running it
Section titled “Running it”Open a contact map and put a model on the Structures card: a g3d, .3dg or bed3d file, a PDB that chromosomix wrote (3D models), or one from Model from the map. Then, on the 3D tasks card of the Analysis panel, greyed until both are there, choose the model under structure and the sequences.
The model must name its sequences as the map does, or the run stops and says so. Each bin takes the mean position of the beads whose middles fall in it, so the model need not be at the map’s resolution; a bin no bead falls in is left out.
The same run from a shell:
chromosomix structuremap <map> --features <structure.bed3d> --structure <structure.bed3d> [--<parameter> <value> …] --out <dir>Parameters
Section titled “Parameters”sequences decides which sequence the pictures are of, the first one named; the table covers every sequence the model and the map share. exponent α changes only the predicted-contacts picture, since every power of 1/d ranks the pairs alike: use the exponent the model was made with, 3 for a model made here at the default.
| Parameter | Takes | Default | What it does |
|---|---|---|---|
structure--structure <file> | a file: a feature set | — | The model to read: a row of the Structures card. |
sequences--region <locus,…> | loci, comma-separated, display form | Every sequence of the file when left out. | The matrices are drawn for the first named; the table covers them all. |
exponent α--alpha <n> | a number, 0.5 to 6 | 3 | Contacts fall as 1/dᵅ in the predicted map; only the picture depends on it. |
use balancing weights--no-balance | a switch | On wherever the file carries balancing weights; --no-balance reads the raw counts. | — |
What it writes
Section titled “What it writes”- matrix: a matrix, a pileup or a heatmap: TSV
- curve: a curve: TSV
- table: a table: TSV
On the command line every file goes into --out as <file stem>.structuremap.<output>.<ext>, and each TSV opens with # lines naming the build, the file and every parameter that produced it.
Reading the result
Section titled “Reading the result”The agreement
Section titled “The agreement”The table gives, for each sequence, and each haplotype on a phased model, Spearman ρ (1/d vs contacts): the rank correlation between the inverse of the model’s distance and the observed contacts, over every pair of modelled bins at least two bins apart. 1 is a model that orders every pair as the map does; near 0, its distances say nothing about the contacts. Bins modelled and Pairs compared say how much of the sequence that number is about.
Being a rank, ρ ignores the exponent and the model’s scale. It is not the ρ at the end of Model from the map’s table, which is over every pair the map counted, across sequences.
The pictures
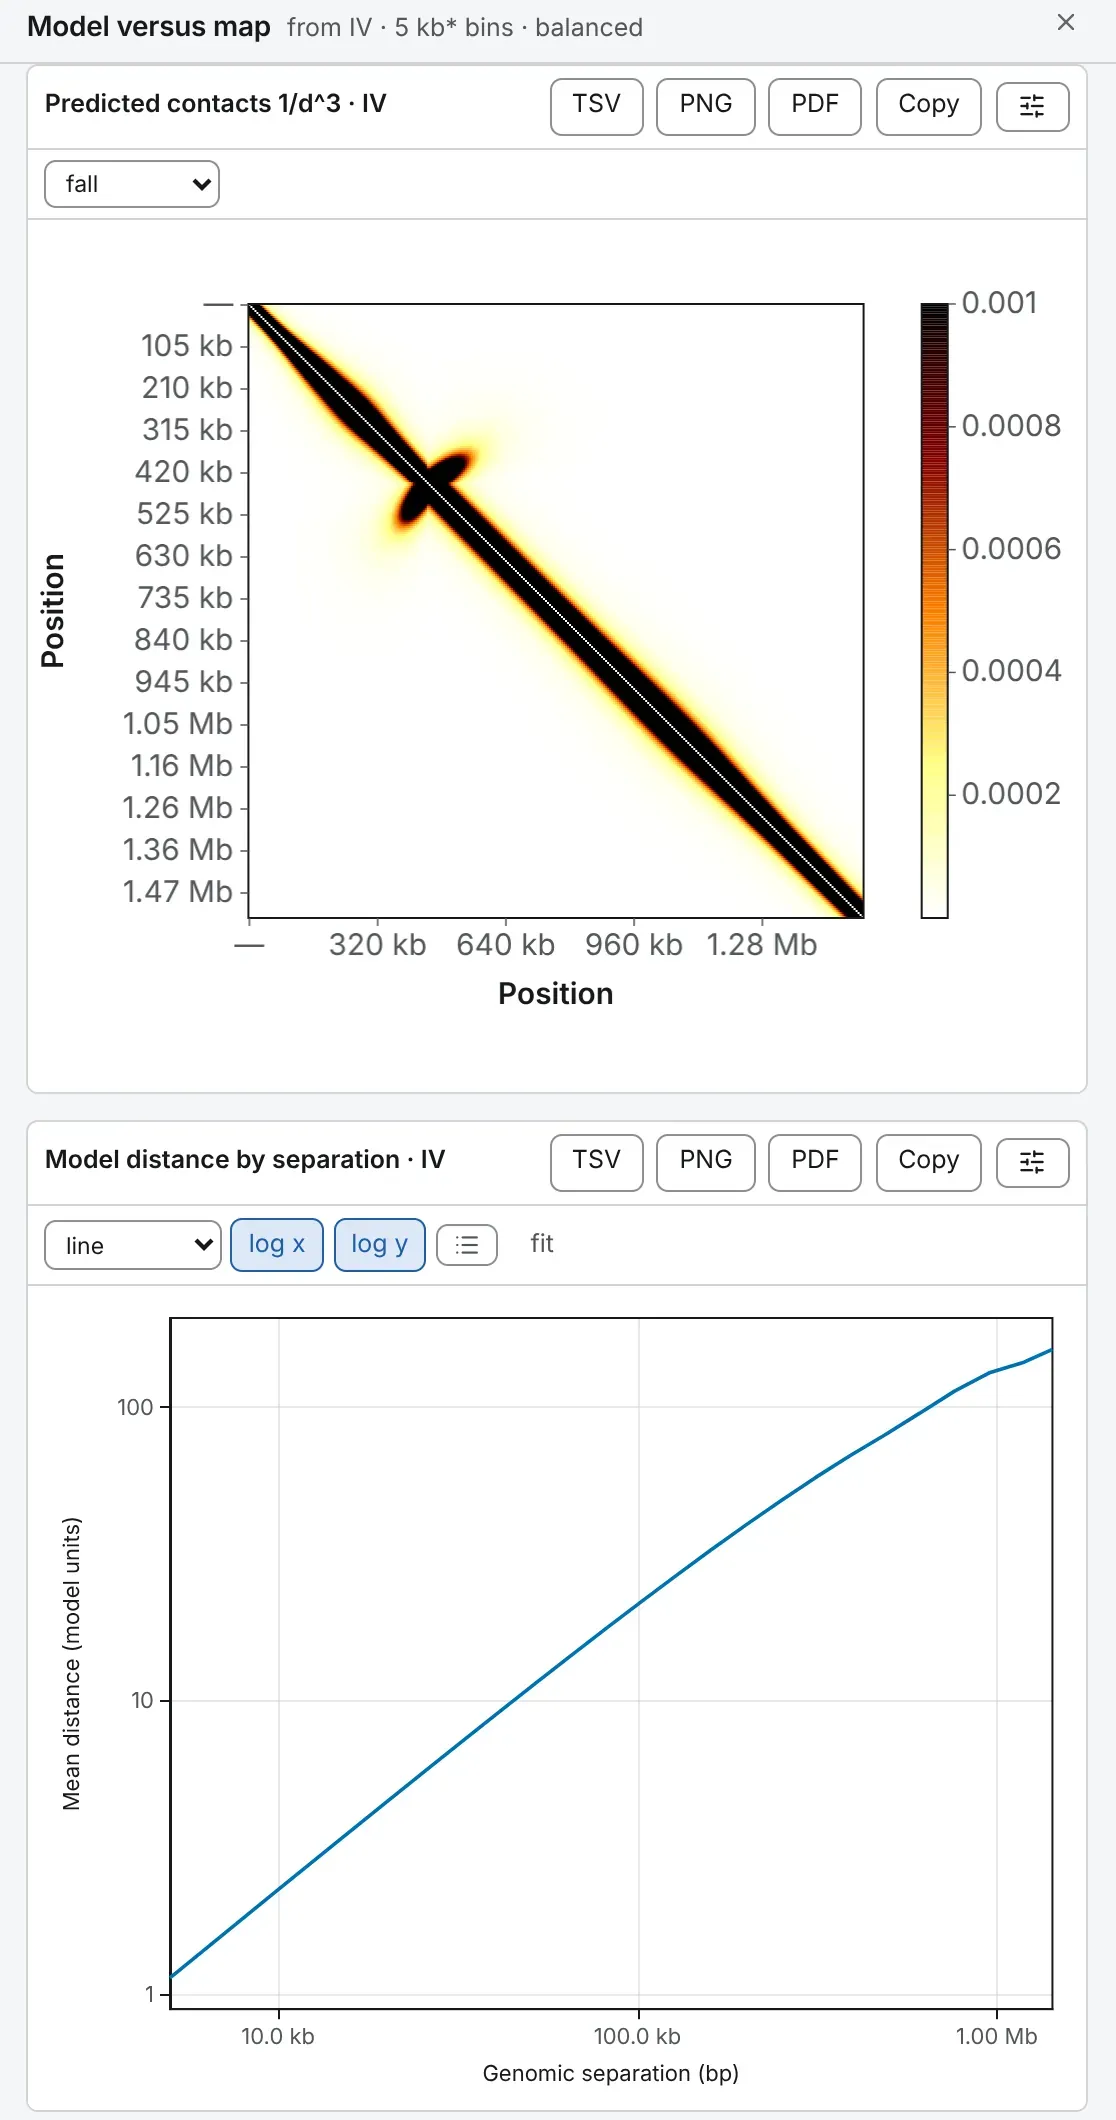
Section titled “The pictures”- Model distances: the model’s distance between every two bins of the sequence, in the map’s frame.
- Predicted contacts: the contact map those distances predict,
1/d^α, up to scale. A faithful model predicts the map’s domains and far contacts. - Model distance by separation: the model’s mean distance at each separation, on log–log axes, then its slope, beside The map’s P(s) over the same bins. Where the map’s contacts fall away with separation, the model’s distances should rise.
To compare one model with another, use compare with on the 3D structure card, which gives the RMSD between the two.
Documentation of chromosomix v0.20.0 · built from 40ec1ec · source