Signal by group
- In the app
- Analysis panel, under 1D tasks: Signal by group
- Command
chromosomix groupsignal- Reads
- Tracks and interval files, with or without a contact map
- Also known as
- A versus B, compartment signal, box plot, test
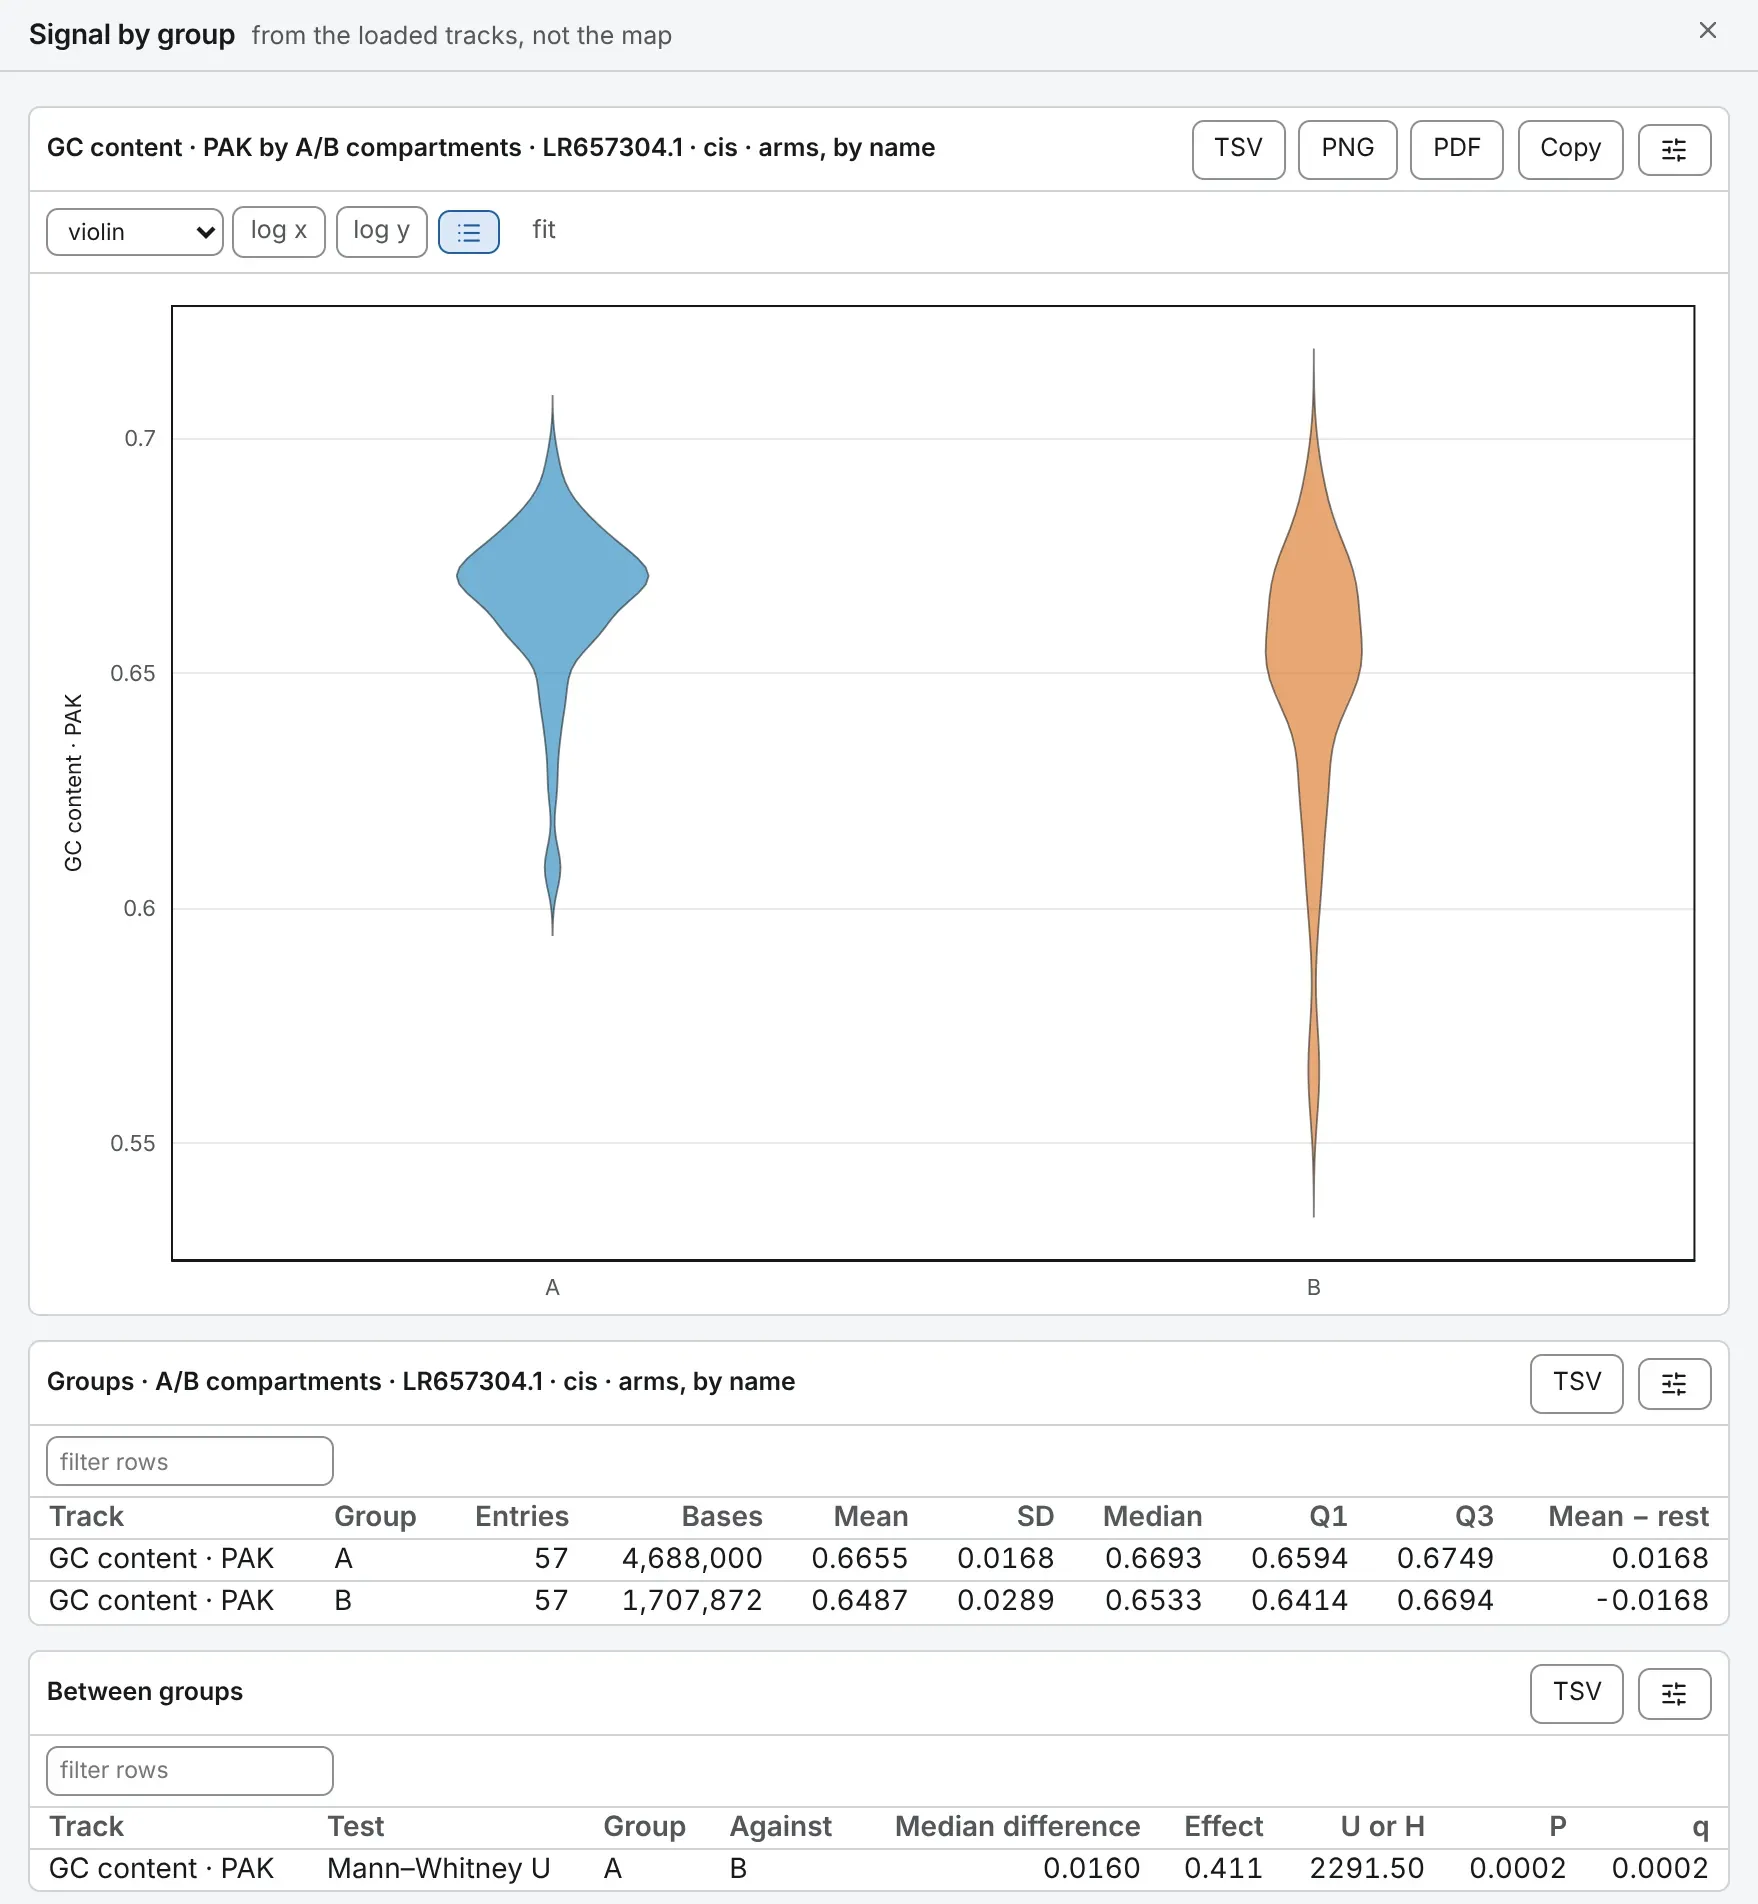
Is compartment A richer in GC than B? Signal by group reads one or more tracks over groups of the genome, draws each group as a violin and tests the groups against one another by ranks.
Running it
Section titled “Running it”Load or make the tracks to compare, such as GC content from Base composition or the eigenvector from Compartments. Open Signal by group on the 1D tasks card of the Analysis panel, tick the tracks, and under groups from choose:
- a feature set (features), split under split the set by by name (A and B on a compartment call), strand, score, in quantiles or nothing: one group. The bases it does not cover are one more group, rest of the genome, unless you turn off the rest as a group.
- a track (grouping track), its bins cut by sign,
above 0andbelow 0, or into quantiles. The bins are bin size wide, or the open map’s, or 10 kb with no map open.
The drawer shows a violin per group for each track, and the tables below. Groups made from a track are also written out as a set of intervals named by group, for other tasks to read.
The same run from a shell:
chromosomix groupsignal [<map>] --tracks <tracks.bw> --features <features.bed> [--<parameter> <value> …] --out <dir>Parameters
Section titled “Parameters”bin size sets what one observation is, and so what the P means. At 0, the default, an entry is one value: a run of a group’s features, merged where they overlap or touch; a stretch of the rest between two of them; or a run of bins in one group. Any other size cuts entries into stretches of at most that many bases. Leave it at 0 to test; set it to describe.
| Parameter | Takes | Default | What it does |
|---|---|---|---|
tracks--tracks <file,…> | files: a signal track | — | The values compared between the groups. |
groups from--groupBy <value> | features or track | features | features — its intervals, split by what is written on them: A and B on a compartment call; track — its bins, cut by sign or into quantiles: an eigenvector’s two compartments. |
features--features <file> | a file: a feature set | — | — |
split the set by--split <value> | name, strand, score or none | name | name — one group per name the features carry; score — score, in quantiles; none — nothing: one group. |
the rest as a group--outside / --no-outside | on or off | on | Every base the set does not cover, as one more group. |
grouping track--groupTrack <file> | a file: a signal track; optional | not used | Read only under other settings of this task. |
cut it by--cut <value> | sign or quantiles | sign | sign — above zero and below it; quantiles — equal numbers of bins, lowest to highest. Read only under other settings of this task. |
quantiles--quantiles <n> | a whole number, 2 to 10 | 4 | Read only under other settings of this task. |
bin size--resolution <n> | a whole number, at least 0, in bp | 0 | 0 compares one value per entry — a run of features, the stretch between two, a run of bins in one group — and any other size compares stretches of at most that many bases. |
score every feature--perFeature / --no-perFeature | on or off | off | A row per feature of the set, its mean on every track. |
What it writes
Section titled “What it writes”- curve: a curve: TSV
- table: a table: TSV
- intervals: a set of intervals: TSV, and BED (or BEDPE for pairs, or bed3d and PDB for a 3D model)
On the command line every file goes into --out as <file stem>.groupsignal.<output>.<ext>, and each TSV opens with # lines naming the build, the file and every parameter that produced it.
Reading the result
Section titled “Reading the result”Groups gives, for each track and group, the entries (or stretches), the bases they cover, the mean, SD, median and quartiles, and Mean − rest: the group’s mean less that of every other stretch. Each value is the track’s exact mean over the bases it has a value for.
Between groups tests every two groups with Mann–Whitney U, giving the Median difference and the rank-biserial Effect: +1 where every value of the group is above every value of the other, −1 where every one is below, 0 where they mix evenly. Three groups or more are also tested together with Kruskal–Wallis H. Both are SciPy’s asymptotic forms, Mann–Whitney with its continuity correction. q is Benjamini–Hochberg over every test of the run, and a very small P or q is written with an exponent, never as 0.
Read the effect, not only the P
Section titled “Read the effect, not only the P”The tests take their observations as independent, and the bins of one compartment are not: cut into bins, a compartment gives more observations, and a smaller P, with no more evidence. On P. aeruginosa, GC in A against B has an effect of 0.42, 0.39 and 0.43 at 8, 32 and 128 kb, and a P of 2·10⁻²⁰, 6·10⁻⁵ and 3·10⁻².
What to watch for
Section titled “What to watch for”- An empty group, such as the rest of the genome beside a call that covers every base, and features on sequences the assembly lacks, are left out and named.
- Cut by sign, a bin with no reading, or reading exactly 0, is in no group; a note counts them.
- A violin of more than 20,000 values is drawn from 20,000 of them; the tests use every value.
Documentation of chromosomix v0.20.0 · built from 40ec1ec · source